Knowledge and skills
Participation in tertiary education
Definition
The proportion of the population aged 15 years and over who participated in tertiary education.
RelevanceTop
The acquisition of a tertiary qualification provides individuals with additional skills and knowledge to participate in society and in the economy.
Provider-based tertiary education supports a range of approved qualifications ranging from certificate level through to Doctoral degrees, and includes universities, institutes of technology and polytechnics, wānanga, public providers and private training establishments.
Current level and trendsTop
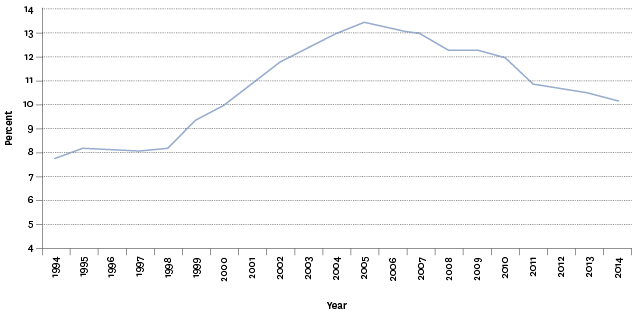
In 2014, the age-standardised tertiary education participation rate was 10.2 percent, a decrease from the previous year (10.5 percent). During 2014, 363,644 people aged 15 years and over were enrolled in formal tertiary education, a decrease from 369,227 people in 2013.
Between 1998 and 2005, there was a rapid rise in age-standardised tertiary participation rates, with rates increasing from 8.2 percent to 13.5 percent. Since this time, rates have declined significantly, falling to 10.2 percent in 2014, which is largely a result of declining participation in sub-degree level qualifications.
Figure K3.1 – Age-standardised tertiary education participation rate, 1994–2014
Source: Ministry of Education
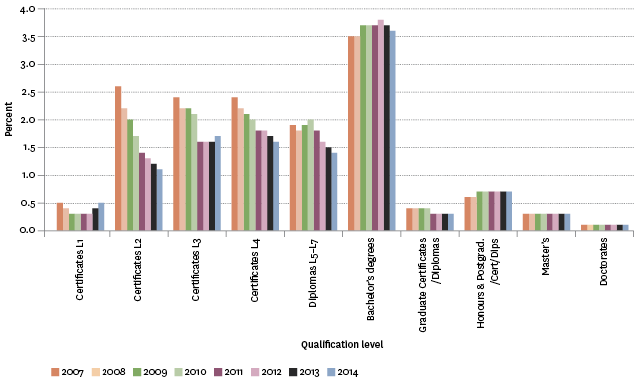
The sharp decline in age-standardised participation rates at sub-degree level followed 2005 reviews of the quality and value for money of sub-degree qualifications and a subsequent emphasis on higher-level, higher-value qualifications. For example, participation in Level 2 Certificates, which provide individuals with introductory knowledge and skills for a field of study, fell by 1.5 percentage points between 2007 and 2014, from 2.6 percent to 1.1 percent.
From 2007, while tertiary participation rates for sub-degree qualifications have declined, degree level participation rates have remained relatively stable. In 2014, the participation rate for a Bachelor’s degree was 3.6 percent, compared with 3.5 percent in 2007. However, the rate has fluctuated over this period, rising to a high of 3.8 percent in 2012 before again falling.
Figure K3.2 – Age-standardised tertiary education participation rate,
by qualification level, 2007–2014
Source: Ministry of Education
Age and sex differencesTop
In 2014, the participation rate for tertiary education was highest for those aged 18–19 years (49.4 percent), followed by those aged 20–24 years (32.1 percent) and 25–39 years (11.6 percent). Rates drop off for older age groups, with 11.6 percent for those aged 25–39 years and 3.8 percent for those over 40 years of age in 2014. While rates for those aged 18–19 years remained the same between 2013 and 2014, the rates for other age groups continued a period of decline.
Females were more likely to participate in tertiary education, with a participation rate of 11.6 percent in 2014, compared with the male rate of 8.7 percent. While the participation rate is higher for females at all qualification levels, the largest difference is at Bachelor’s degree level, with females having a participation rate of 4.5 percent in 2014, compared with a rate of 2.7 percent for males. Although slightly more pronounced for males, declining tertiary participation rates have been experienced by both males and females, in line with overall trends. Between 2007 and 2014, male rates dropped 3.4 percentage points, while female rates dropped 2.3 percentage points.
Table K3.1 – Tertiary education participation rate, by age group and sex, 2007–2014
| Year | Under 18 | 18–19 | 20–24 | 25–39 | 40+ | Male | Female | Total |
|---|---|---|---|---|---|---|---|---|
| 2007 | 9.5 | 46.2 | 33.1 | 15.6 | 7.4 | 12.1 | 13.9 | 13.0 |
| 2008 | 9.1 | 46.3 | 33.4 | 14.4 | 6.5 | 11.1 | 13.5 | 12.3 |
| 2009 | 8.6 | 48.7 | 35.1 | 14.6 | 6.1 | 10.9 | 13.6 | 12.3 |
| 2010 | 8.0 | 49.5 | 35.9 | 14.4 | 5.6 | 10.7 | 13.3 | 12.0 |
| 2011 | 7.5 | 48.3 | 34.4 | 13.0 | 4.6 | 9.4 | 12.4 | 10.9 |
| 2012 | 7.4 | 49.3 | 34.1 | 12.5 | 4.3 | 9.1 | 12.1 | 10.7 |
| 2013 | 9.7 | 49.4 | 33.3 | 12.1 | 4.1 | 9.0 | 12.0 | 10.5 |
| 2014 | 9.6 | 49.4 | 32.1 | 11.6 | 3.8 | 8.7 | 11.6 | 10.2 |
Source: Ministry of Education
Note: Figures for males, females and the total are age standardised.
Ethnic differencesTop
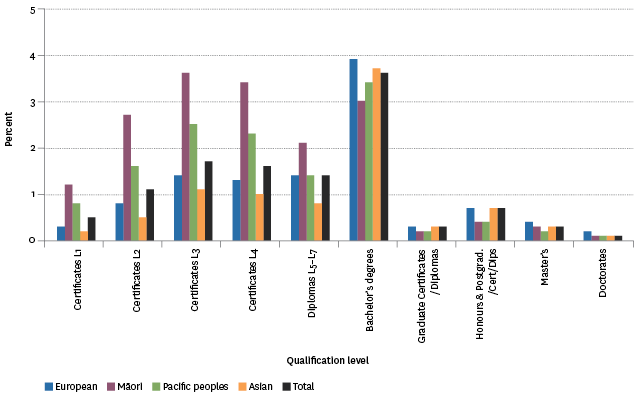
In 2014, Māori had the highest age-standardised tertiary participation rate (14.7 percent), followed by Pacific peoples (11.4 percent), Europeans (9.9 percent) and the Asian ethnic group (8.2 percent). Variations in the rate, ranking and spread of participation rates across ethnic groups in 2014, and over time, are strongly influenced by differences in the qualification level at which students are participating.
The high participation rate for Māori is a reflection of very high participation rates for certificate level qualifications. Māori have lower participation rates than other ethnic groups at Bachelor’s level and above, but the difference at this level is not as pronounced as for the lower level qualifications. Pacific peoples show a similar pattern to Māori. The pattern of participation across qualification levels is most similar for the Asian and European ethnic groups, although Europeans have higher participation rates in sub-degree level qualifications.
Figure K3.3 – Age-standardised tertiary education participation rate, by qualification
level and ethnic group, 2014
Source: Ministry of Education
All ethnic groups, other than Pacific peoples, experienced declines in participation rates between 2007 and 2014, largely as a result of declines in participation in certificate level qualifications. This is most apparent for the Asian ethnic group, where the rate declined by 5.8 percentage points from 14.0 percent in 2007 to 8.2 percent in 2014, mainly because of certificate level qualification declines. Rates for Pacific peoples have been more stable and they experienced the lowest decline between 2007 and 2014, declining 0.2 percentage points from 11.6 to 11.4 percent. In the case of Pacific peoples, there was a much smaller decline in certificate level participation rates and improvements in participation at Bachelor’s degree level.
Table K3.2 – Age-standardised tertiary education participation rate,
by ethnic group, 2007–2014
| Year | European | Māori | Pacific peoples | Asian | Total |
|---|---|---|---|---|---|
| 2007 | 12.5 | 17.5 | 11.6 | 14.0 | 13.0 |
| 2008 | 11.7 | 16.6 | 11.5 | 12.2 | 12.3 |
| 2009 | 11.7 | 16.9 | 11.8 | 12.0 | 12.3 |
| 2010 | 11.4 | 16.5 | 11.9 | 11.5 | 12.0 |
| 2011 | 10.3 | 15.1 | 11.4 | 10.1 | 10.9 |
| 2012 | 10.1 | 14.5 | 11.3 | 9.5 | 10.7 |
| 2013 | 10.2 | 14.7 | 11.9 | 8.9 | 10.5 |
| 2014 | 9.9 | 14.7 | 11.4 | 8.2 | 10.2 |
Source: Ministry of Education
Socio-economic differencesTop
Median income has been used as a proxy for socio-economic status. Data from the New Zealand Income Survey (NZIS) showed that, in the June quarter 2014, people 15 years and over with a highest qualification of upper secondary school level had a median weekly income of $394. This compared with a median weekly income of $600 for those with a Level 1–3 post-school certificate, and a median weekly income of $1,151 dollars for those with a postgraduate qualification.
International comparisonTop
There are no internationally comparative figures to measure tertiary participation. The OECD does, however, report on enrolment rates in education for full-time and part-time students in public and private institutions at all education levels. Data is available for those aged 20–29 years – the age group usually enrolled in tertiary education. For younger age groups, it is difficult to differentiate tertiary from school level education.
The OECD enrolment rate for New Zealand has been trending down and declined between 2005 and 2012 from 32 percent to 29 percent. This compares with the OECD median across 28 countries over the same period, which was trending up and increased from 25 to 28 percent.
Data for this section can be found at: www.socialreport.msd.govt.nz/documents/2016/k3.xlsx
