Cultural identity
Language retention
Definition
The proportion of the population who could speak the “first language” of their ethnic group, for ethnic groups (other than Māori) with an established resident population in New Zealand.
RelevanceTop
The ability of people to speak the language of their identified ethnicity is an indicator of the ability of ethnic groups to retain and pass on their culture and traditions to future generations. Language is a central component of cultural identity.
The ability to speak a first language is defined as being able to hold an everyday conversation in that language. First language refers to at least one first language associated with a given ethnicity, as opposed to the first language of a person. Sign language, English and Māori are not treated as a first language for the purpose of the indicator.
Current level and trendsTop
In the 2013 Census, the proportion of people who could hold an everyday conversation in the first language of their ethnic group varied widely between ethnic groups, from 13.0 percent of Cook Islands Māori to 85.9 percent of Koreans.
Between 2001 and 2013, a number of ethnic groups experienced changes in the proportion of people who could speak their first language. There were decreases in the proportion of people who could speak the first language of their ethnic group among all Pacific ethnic groups except Fijian. Among the European ethnic groups, those of Croatian ethnicity experienced the largest decrease in the proportion of people who could speak their language. Asian ethnic groups, and particularly Chinese and Korean, were more likely to speak their first language, with little change in proportions over time. Small numbers for some ethnic groups and changing population sizes may impact on changes over time.
Figure CI3.1 – Proportion of people who could speak the first language of their
ethnic group, 2001–2013
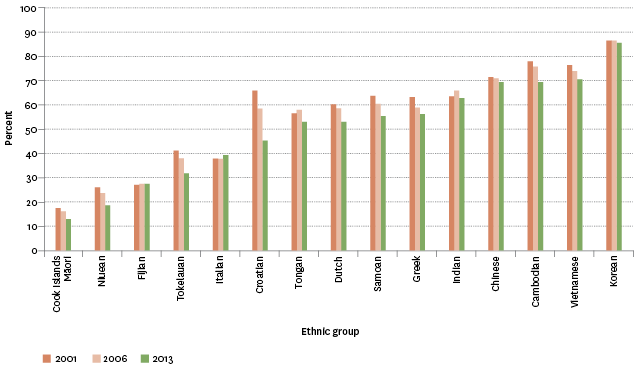
Source: Statistics New Zealand, Census of Population and Dwellings
For all selected ethnic groups, those who were born in New Zealand were considerably less likely to be able to speak the first language of their ethnic group than those who were born overseas.
Figure CI3.2 – Proportion of people who could speak the first language of their
ethnic group, by birthplace, 2013
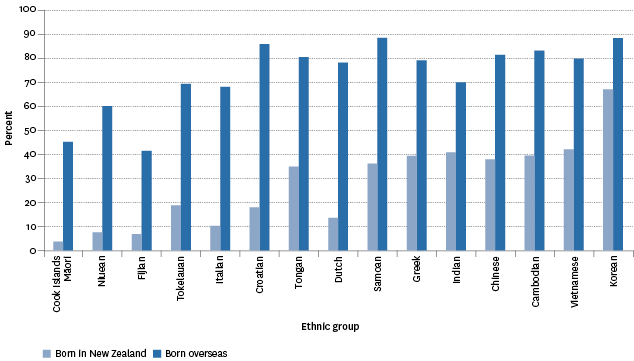
Source: Statistics New Zealand, Census of Population and Dwellings
Age and sex differencesTop
In all selected ethnic groups, younger people were less likely than older people to be able to hold an everyday conversation in the first language of their ethnic group.
In Pacific and Asian ethnic groups, females tended to be slightly more likely than males to speak the first language of their ethnic group, but the reverse was true in most European ethnic groups.
Table CI3.1 – Proportion of people in selected ethnic groups who can speak the
first language of their ethnic group, by age group and sex, 2013
| Under 15 | 15–24 | 25–34 | 35–44 | 45–54 | 55–64 | 65–74 | 75+ | Male | Female | Total | |
|---|---|---|---|---|---|---|---|---|---|---|---|
| Pacific | |||||||||||
| Samoan | 35.7 | 52.0 | 63.9 | 68.8 | 74.8 | 85.4 | 90.6 | 92.6 | 54.9 | 56.3 | 55.6 |
| Cook Islands Māori | 3.2 | 6.6 | 12.1 | 16.9 | 27.3 | 40.4 | 56.0 | 64.8 | 12.3 | 13.5 | 13.0 |
| Tongan | 35.5 | 50.9 | 64.4 | 68.5 | 77.1 | 76.8 | 83.8 | 85.2 | 52.9 | 53.5 | 53.2 |
| Niuean | 4.9 | 9.0 | 18.9 | 27.8 | 40.1 | 51.1 | 64.3 | 75.8 | 17.4 | 19.8 | 18.7 |
| Tokelauan | 14.6 | 23.2 | 38.2 | 44.3 | 64.0 | 70.9 | 77.8 | 76.7 | 30.4 | 33.3 | 31.9 |
| Fijian | 13.2 | 25.2 | 29.6 | 37.7 | 39.1 | 42.2 | 43.0 | 49.3 | 28.2 | 27.1 | 27.7 |
| Asian | |||||||||||
| Chinese | 44.0 | 64.5 | 73.3 | 75.1 | 79.3 | 84.9 | 86.1 | 88.7 | 67.5 | 71.5 | 69.6 |
| Indian | 44.3 | 57.2 | 66.3 | 70.6 | 71.6 | 76.5 | 81.2 | 80.9 | 61.0 | 65.0 | 63.0 |
| Cambodian | 40.7 | 64.8 | 76.1 | 82.0 | 89.9 | 91.3 | 90.7 | 85.5 | 67.1 | 72.2 | 69.8 |
| Vietnamese | 46.8 | 68.2 | 74.1 | 79.4 | 87.7 | 87.7 | 85.1 | 93.1 | 68.6 | 72.6 | 70.8 |
| Korean | 74.2 | 85.7 | 84.6 | 88.4 | 92.2 | 91.6 | 94.2 | 94.7 | 84.6 | 87.0 | 85.9 |
| European | |||||||||||
| Dutch | 15.0 | 21.2 | 38.8 | 61.4 | 64.6 | 72.5 | 80.8 | 78.7 | 52.7 | 53.7 | 53.3 |
| Greek | 20.3 | 27.2 | 42.2 | 67.3 | 76.2 | 81.2 | 88.3 | 93.1 | 56.8 | 56.3 | 56.4 |
| Croatian | 7.4 | 27.6 | 40.8 | 49.6 | 58.6 | 67.9 | 76.4 | 76.9 | 47.8 | 43.4 | 45.4 |
| Italian | 17.3 | 16.9 | 47.6 | 45.8 | 55.9 | 60.3 | 67.7 | 78.5 | 41.0 | 37.4 | 39.4 |
Source: Statistics New Zealand, Census of Population and Dwellings
Data for this section can be found at: www.socialreport.msd.govt.nz/documents/2016/ci3.xlsx
