Social connectedness
Voluntary work
Definition
The proportion of the population aged 15 years and over who reported doing voluntary work for a group or organisation in the past four weeks.
RelevanceTop
Voluntary work underpins a wide range of groups and organisations whose activities contribute to social wellbeing including health; education; sports and recreation; social services; arts and culture; human rights; emergency services; the environment and conservation; animal welfare; and community support and development.
Volunteers provide their time and skills to help others and to make a contribution. People also volunteer so they can meet others, develop their skills and broaden their experiences, make contacts that may lead to employment, and fulfil parental, social, cultural and religious obligations.
Current level and trendsTop
The proportion of people volunteering decreased slightly (1.6 percentage points) between 2008 and 2012.
Figure SC6.1 – Proportion of population aged 15 years and over who reported
doing voluntary work in the past four weeks, 2008–2012
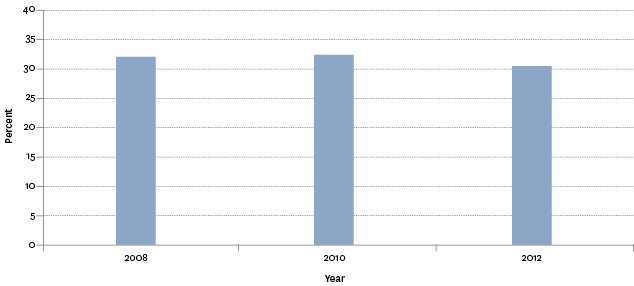
Source: Statistics New Zealand, New Zealand General Social Survey
Most people volunteered either once or twice a week (39.5 percent) or once a fortnight or less (43.2 percent). Most volunteer work involved face-to-face contact with people (92.9 percent). There were no differences in terms of frequency of face-to-face contact by sex, age group or ethnic group.
Age and sex differencesTop
There were small differences between males and females, with females slightly more likely to have done voluntary work in the past four weeks (31.7 percent, compared with 29.5 percent for males in 2012). Small differences have also been found in 2008, while slightly more males (32.6 percent) than females (32.5 percent) reported doing voluntary work in 2010.
In 2012, people aged 65 years and over and between 45–54 years were most likely to have done voluntary work in the past four weeks (35.0 percent and 34.4 percent respectively). Those aged 15–24 years (27.8 percent) and 25–34 years (24.8 percent) were least likely to undertake voluntary work.
Lower proportions of the younger age groups (ie 15–24; 25–34 years) also undertook voluntary work in 2008 and 2010.
Table SC6.1 – Proportion of population aged 15 years and over who reported
doing voluntary work in the past four weeks, by age group and sex, 2008–2012
| 15–24 | 25–34 | 35–44 | 45–54 | 55–64 | 65+ | |
|---|---|---|---|---|---|---|
| 2008 | ||||||
| Male | 30.0 | 24.1 | 31.3 | 35.1 | 36.7 | 33.9 |
| Female | 25.5 | 25.9 | 38.6 | 35.1 | 36.8 | 34.3 |
| Total | 27.8 | 25.0 | 35.1 | 35.1 | 36.7 | 34.1 |
| 2010 | ||||||
| Male | 29.6 | 25.7 | 35.0 | 35.8 | 37.2 | 33.2 |
| Female | 28.1 | 25.8 | 34.8 | 37.6 | 35.0 | 33.4 |
| Total | 28.8 | 25.8 | 34.9 | 36.7 | 36.1 | 33.3 |
| 2012 | ||||||
| Male | 24.7 | 25.4 | 28.4 | 34.9 | 28.8 | 35.1 |
| Female | 31.1 | 24.3 | 32.1 | 33.9 | 34.0 | 35.0 |
| Total | 27.8 | 24.8 | 30.4 | 34.4 | 31.4 | 35.0 |
Source: Statistics New Zealand, New Zealand General Social Survey
Ethnic differencesTop
In 2012, people who identified as European/Other were more likely than those in the Asian ethnic group to volunteer (31.5 percent compared with 21.6 percent). Pacific peoples and Māori had similar proportions of volunteering to European/Other (34.1 percent and 31.4 percent respectively).
In general, there has been a drop in volunteering for all ethnic groups between 2010 and 2012.
Figure SC6.2 – Proportion of population aged 15 years and over who reported
doing voluntary work in the past four weeks, by ethnic group, 2008–2012
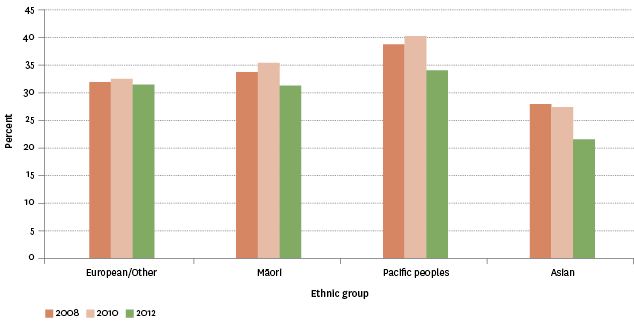
Source: Statistics New Zealand, New Zealand General Social Survey
Socio-economic differencesTop
In 2012, income level did not appear to affect volunteering: 29.4 percent of people with a personal income of $30,000 or less volunteered in the last four weeks, compared with 30.7 percent of those in the $30,001–$70,000 income group and 34.6 percent of those in the $70,001 and over group.
The proportion of people volunteering generally increased as people's material wellbeing increased. In 2012, 34.2 percent of people in the higher material wellbeing index category reported volunteering in the past four weeks, compared with 24.1 percent of people living in the lower material wellbeing index category. The proportion of people in the lower middle and upper middle categories were 29.6 percent and 28.8 percent respectively.
Labour force status differencesTop
In 2012, those unemployed were slightly more likely to volunteer in the past four weeks (34.7 percent, compared with 30.7 percent of employed people and 29.9 percent of people who were not in the labour force (eg retired, studying, caring for others)).
Family type differencesTop
Couples, with and without children, were more likely than other groups to undertake volunteering. In 2012, 34.7 percent of people living in a couple with children and 31.4 percent of people living in a couple without children were volunteers, compared with 24.8 percent for people not in a family nucleus and 22.9 percent of sole-parent families.
Migrant status differencesTop
In 2012, recent migrants (18.2 percent) were less likely to volunteer, compared with 32.1 percent of people born in New Zealand, and 29.1 percent of longer-term migrants. There was a 10.5 percentage point decrease in the proportion of recent migrants volunteering compared with 2008.
Regional differencesTop
In 2012, people living in Otago (38.6 percent) and Taranaki (36.4 percent) had the highest volunteering rates. People living in Auckland (27.7 percent) and Northland (28.8 percent) had the lowest rates.
International comparisonTop
Comparisons can be made with OECD countries by looking at the proportion of people who reported having volunteered some of their time during the previous 12 months. In 2014 or the latest available year, New Zealand had the highest proportion of people volunteering at 45 percent; Australia had 40 percent and the United States had 44 percent. The OECD mean and median were 26 percent, with Greece having the lowest proportion with 7 percent of its people volunteering some of their time during the previous 12 months.
Data for this section can be found at: www.socialreport.msd.govt.nz/documents/2016/sc6.xlsx
