Social wellbeing summary
Comparisons with OECD countries
This part looks at New Zealanders’ social wellbeing relative to that of people in OECD countries. It should be noted that, in some cases, the internationally comparative measures presented may differ from the New Zealand measures used in the Social Report, and not all the international data provided in this report is presented here. This reflects the difficulty in making direct international comparisons for many indicators.
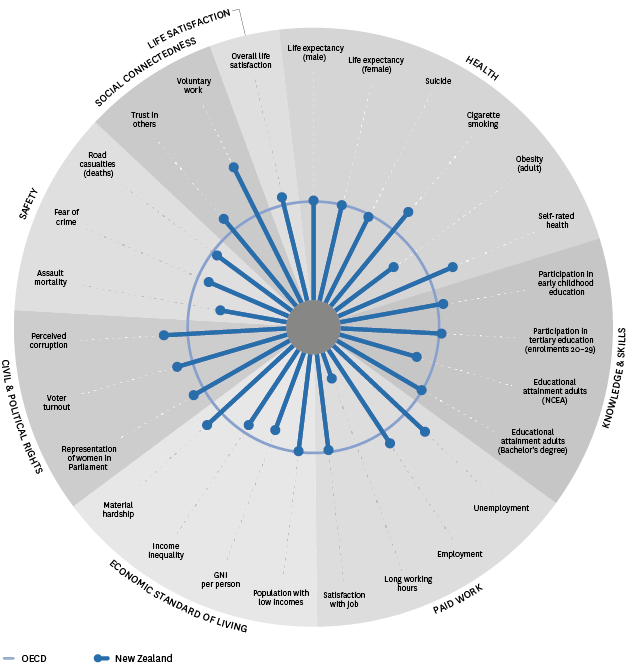
For the measures presented, New Zealand is ahead of, or close to, the OECD median for over two-thirds of comparable measures reported in Figure SU1.2.
In the Health domain, New Zealand is performing better than the OECD median for cigarette smoking and self-rated health. There are similar results for life expectancy and suicide, but obesity rates are worse than the OECD median.
In the Knowledge and Skills domain, results are slightly better than the OECD median for early childhood participation and for tertiary enrolments of 20–29 year olds. While New Zealand has similar results for attainment at Bachelor’s degree level for 25–64 year olds, this age group does less well in terms of those with at least upper secondary education.
In terms of paid work, while New Zealand’s long-term results are generally poorer in comparison with the OECD median, New Zealand does comparatively well for both unemployment and employment. Job satisfaction is similar to the OECD median but New Zealand is not performing well in the measure on working long hours (which reflects the headline measure of work-life balance).
New Zealand’s measures in the Economic Standard of Living domain tend to be lower than or similar to the OECD median, with higher rates of income inequality, lower gross national income per person, and similar rates for the proportion of the population in households with low incomes. New Zealanders, however, do better overall for material wellbeing.
In the Civil and Political Rights domain, over time New Zealand does very well against the OECD median. In particular, New Zealand is doing better than the OECD for perceived corruption, voter turnout and representation of women in government.
For the Safety domain, the comparative picture with the OECD is less impressive, with higher rates for assault mortality and fear of crime but similar rates for road casualty deaths.
In terms of the Social Connectedness and Life Satisfaction domains, New Zealand is again doing well with better results than the OECD for trust in others, voluntary work and a similar result for overall life satisfaction.
Figure SU1.2 – Social wellbeing in New Zealand, relative to OECD countries

| Interpreting “Social wellbeing in New Zealand, relative to OECD countries” This figure shows New Zealanders’ social wellbeing relative to that of people in OECD countries for comparable indicators. The circle  represents the OECD median or mean for each indicator, while the spokes represents the OECD median or mean for each indicator, while the spokes  represent New Zealand’s outcomes relative to the OECD. Where a spoke falls outside the circle, the New Zealand outcome is better than the OECD median for that indicator. Where a spoke falls inside the circle, the New Zealand outcome is worse than the OECD median. An important limitation of this style of presentation is that we cannot directly compare the size of New Zealand-OECD differences for different indicators. represent New Zealand’s outcomes relative to the OECD. Where a spoke falls outside the circle, the New Zealand outcome is better than the OECD median for that indicator. Where a spoke falls inside the circle, the New Zealand outcome is worse than the OECD median. An important limitation of this style of presentation is that we cannot directly compare the size of New Zealand-OECD differences for different indicators.For each indicator, the most recent data has been used where possible. Most of the data is for the years between 2005 and 2014. SOME CAUTION IS REQUIRED WITH THIS DATA: international comparisons are difficult to interpret because of the different methods countries use to collect, classify and record social data. In some cases the indicator used will differ from the headline indicator used in this report. Users should refer to the indicator section for more information about this. |
|---|

