Leisure and recreation
Satisfaction with leisure time
Definition
The proportion of the population aged 15 years and over who reported having the “right amount” of free time in the last four weeks.
RelevanceTop
Leisure or free time is a crucial component of a balanced and healthy lifestyle. It is a time when people can do what they want to, separate from work and other commitments. Free time is defined as time where people have nothing to do, and does not include things like housework and childcare.
Current level and trendsTop
In 2012, 47.6 percent of the population aged 15 years and over reported having the right amount of free time in the last four weeks, as measured by the New Zealand General Social Survey (NZGSS). One in ten (10.7 percent) felt that they had too much free time, while 41.8 percent felt that they did not have enough free time.
Figure L1.1 – Proportion of population aged 15 years and over, by views on amount
of free time in the last four weeks, 2008–2012

Source: Statistics New Zealand, New Zealand General Social Survey
In 2012, around half of people (51.3 percent) had free time activities or interests that they would like to have done but couldn't, while 63.3 percent had free time activities and interests they would like to do more of.
Being too busy with their jobs (46.3 percent) or their families (34.6 percent), and cost (36.9 percent) were the key reasons why people couldn’t do all the activities or interests they wanted to do in their free time.
Age and sex differencesTop
In 2012, males and females were equally likely to feel that they had the right amount of free time in the last four weeks (47.6 percent for males and 47.5 percent for females). A similar result was found in previous years.
Unsurprisingly, people in the older age groups were most likely to feel they had the right amount of free time in the last four weeks (67.7 percent for those aged 65 years and over). Those aged 35–44 years had the lowest proportion of people who felt they had the right amount of free time (34.9 percent in 2012).
These results are similar to previous years.
Table L1.1 – Proportion of population aged 15 years and over who reported
having the right amount of free time in the last four weeks, by sex and age group, 2008 –2012
| 15–24 | 25–34 | 35–44 | 45–54 | 55–64 | 65+ | |
|---|---|---|---|---|---|---|
| 2008 | ||||||
| Male | 51.7 | 37.2 | 37.1 | 40.1 | 47.3 | 69.2 |
| Female | 48.4 | 34.0 | 34.5 | 39.1 | 53.1 | 71.7 |
| Total | 50.1 | 35.5 | 35.7 | 39.6 | 50.2 | 70.5 |
| 2010 | ||||||
| Male | 45.4 | 40.9 | 34.5 | 39.3 | 48.3 | 65.2 |
| Female | 49.6 | 39.5 | 32.6 | 39.8 | 52.5 | 72.2 |
| Total | 47.5 | 40.2 | 33.5 | 39.5 | 50.5 | 68.9 |
| 2012 | ||||||
| Male | 50.6 | 45.5 | 33.8 | 40.7 | 48.6 | 67.1 |
| Female | 49.5 | 39.0 | 35.8 | 43.4 | 49.0 | 68.2 |
| Total | 50.1 | 42.2 | 34.9 | 42.1 | 48.8 | 67.7 |
Source: Statistics New Zealand, New Zealand General Social Survey
Ethnic differencesTop
In 2012, Pacific peoples were most likely to report they had the right amount of free time (50.7 percent) in the last four weeks, while Māori were least likely (40.5 percent). Māori, on the other hand, had the highest proportion of people saying that they had too much free time (17.4 percent, compared with 9.8 percent for European/Others).
In general, the proportion of people who reported having the right amount of free time increased slightly over time for all ethnic groups, with the exception of Māori which has shown a steady decrease. Pacific peoples had a slight decrease in 2012.
Figure L1.2 – Proportion of population aged 15 years and over who reported having
the right amount of free time in the last four weeks, by ethnic group, 2008 –2012
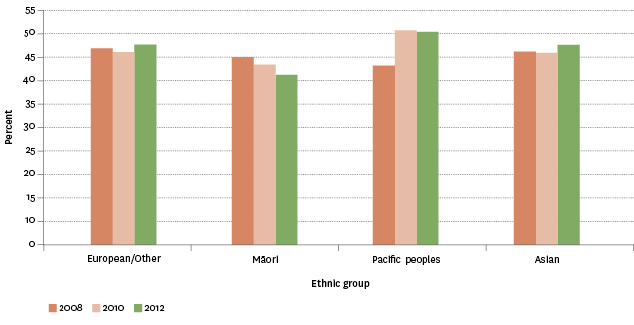
Source: Statistics New Zealand, New Zealand General Social Survey
Socio-economic differencesTop
In 2012, people with a personal income of $30,000 or less (52.7 percent) were more likely to report having the right amount of free time in the last four weeks, compared with other income groups (42.7 percent of those with incomes between $30,001 and $70,000 and 41.6 percent of those with incomes of $70,001 and over).
The proportion of people reporting they had the right amount of free time increased as their material wellbeing increased. In 2012, 53.7 percent of people in the higher material wellbeing index category reported having the right amount of free time, compared with 38.6 percent of people in the lower material wellbeing index category. The proportion of people in the lower middle and upper middle categories were 40.1 percent and 47.6 percent respectively.
Labour force status differencesTop
In 2012, those not in the labour force (eg retired, studying, caring for others) were more likely to report having the right amount of free time in the last four weeks (57.1 percent, compared with 43.5 percent of employed people and 42.4 percent of unemployed people).
Family type differencesTop
People without children were more likely to say they have the right amount of free time. In 2012, over half of people living in a couple without children (54.4 percent) and people not in a family nucleus (54.3 percent) had the right amount of free time, compared with 40.7 percent of people living in a couple with children and 43.7 percent of sole-parent families.
Migrant status differencesTop
Similar levels of satisfaction with leisure time were found by migrant status. In 2012, 50.9 percent of recent migrants who arrived in New Zealand within the last five years had the right amount of free time, compared with 47.4 percent of longer-term migrants and 47.3 percent of people born in New Zealand.
Regional differencesTop
In 2012, Auckland and Southland had the highest proportions of people who said they had the right amount of free time in the last four weeks (50.2 percent each). Northland (41.5 percent) and Waikato (43.5 percent) had the lowest proportions.
Data for this section can be found at: www.socialreport.msd.govt.nz/documents/2016/l1.xlsx
