People
Introduction
The Social Report monitors outcomes for the New Zealand population. To provide a context for the indicators that follow, this section contains background information on the size and characteristics of the population.
Population size and growthTop
New Zealand’s estimated resident population at 30 June 2014 was 4,509,900.
Between 1948 and 2014, New Zealand’s population grew by an average of 1.3 percent a year. Over this time, the growth rates slowed as fertility rates fell and the population age structure changed. Population growth averaged 2.2 percent during the 1950s, but slowed to 0.7 percent during the 1980s. In the decade ending 2014, New Zealand’s population growth averaged 1.0 percent.
It is expected that New Zealand’s population will increase to between 4.91 and 5.16 million in 2025, and to between 5.28 and 7.17 million in 2068. Annual population growth is expected to average 1.0 percent in the decade ending 2020, and then slowly decline to 0.3 percent in the decade ending 2060.
Figure P1.1 – Change in New Zealand population, 1937–2068
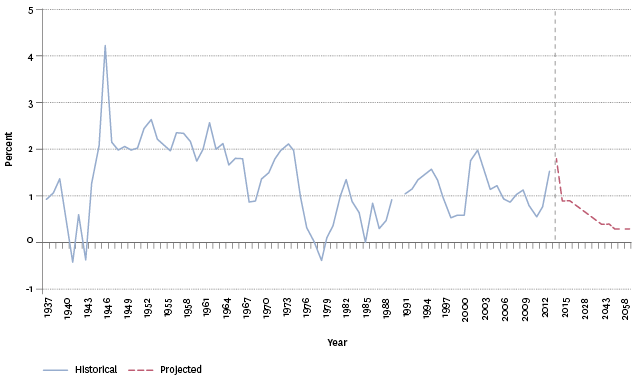
Source: Statistics New Zealand
Note: Estimates from 1991 onwards are not strictly comparable with estimates for earlier years, owing to conceptual differences.
Components of population changeTop
New Zealand’s estimated resident population grew by 67,800 (1.5 percent) in the year to June 2014, with natural increase (births minus deaths) contributing 29,500 and net migration contributing 38,300. This is the highest gain from net migration in a June year since 2003, and is more than 30,000 higher than in the previous year.
Figure P1.2 – Components of population change, 1992–2014
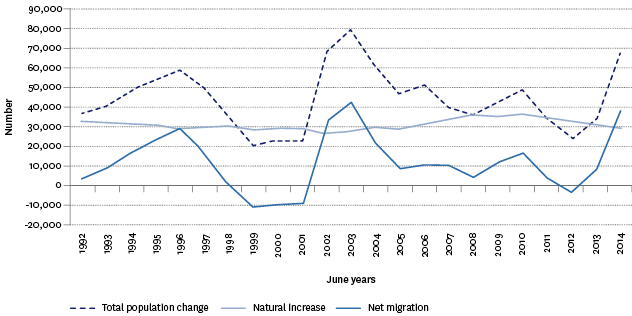
Source: Statistics New Zealand
In the year to June 2014, new migrants were most likely to come from Australia (22.0 percent of new migrants), the United Kingdom (13.7 percent), China (8.8 percent) and India (8.2 percent). Over time, the proportion of migrants from India has increased, while the proportion from the United Kingdom has decreased.
Looking forward, births are expected to average at least 60,000 a year. In comparison, deaths are expected to gradually increase over time as a result of population growth as more people reach the older ages where most deaths occur. Deaths will increase from 30,000 in 2015 to more than 40,000 by the late 2030s and 50,000 by the 2050s. With deaths rising faster than births, annual natural increase is likely to decrease.
The infant mortality rate (ie infant deaths (aged under one year) per 1,000 live births) declined from 24.1 in 1954 to 15.5 in 1974 and 7.0 in 1994. In 2014, the infant mortality rate was 5.7 deaths per 1,000 live births.
Ethnic composition of the populationTop
Māori were the next largest ethnic group (599,000 or 14.9 percent, up from 14.6 percent in 2006).
The third largest ethnic group was Asian (472,000 or 11.8 percent, up from 9.2 percent in 2006). Within the Asian group, Chinese contributed 36.3 percent (4.3 percent of the total New Zealand population) and Indians 32.9 percent (3.9 percent of the total New Zealand population).
A total of 7.4 percent identified as Pacific (296,000, up from 6.9 percent in 2006). Within the Pacific group, Samoans contributed 48.7 percent (3.6 percent of the total New Zealand population), followed by Cook Islands Māori (20.9 percent; 1.5 percent of the total population), Tongan (20.4 percent; 1.5 percent of the total population) and Niuean (8.1 percent; 0.6 percent of the total population).
A total of 47,000 people (1.2 percent) identified as Middle Eastern, Latin American or African (MELAA), up from 0.9 percent in 2006.
Figure P1.3 – Ethnic composition, 2001–2013
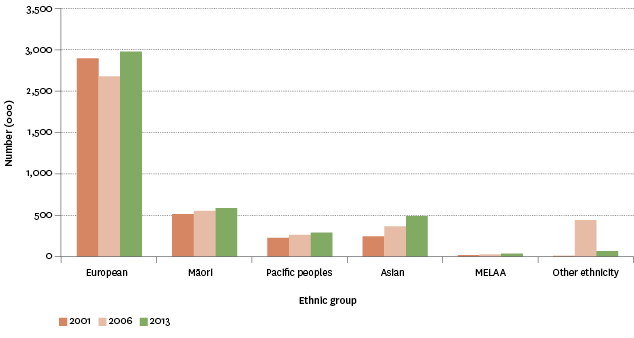
Source: Statistics New Zealand
Note: People were able to identify with more than one ethnic group.
Identifying with more than one ethnic group was common among Māori (53.5 percent) and Pacific peoples (37.2 percent), but less likely for Europeans (13.3 percent) and MELAA (16.8 percent). The proportion of people identifying with multiple ethnicities increased from 9.0 percent in 2001 to 10.4 percent in 2006 and 11.2 percent in 2013.
It is expected that the Māori, Asian and Pacific populations will continue to increase their share of the total population, and that the Asian population will exceed the Māori population from the mid-2020s.
Age and sex structure of the populationTop
In 2014, there were 96.1 males to every 100 females.
Just over half of New Zealand’s population was aged between 0 and 39 years (20.4 percent were aged between 0 and 14 years and 32.3 percent were aged between 15 and 39 years). One-third (33.0 percent) of the population was aged between 40 and 64 years, while 14.4 percent of people were 65 years or over.
Since 1986, the proportion of people in the 0–14 and 15–39 year age groups has decreased, while the proportions of people in the 40–64 year and 65 years and over age groups has increased.
Table P1.1 – Proportion of population, by age group, 1981–2013
| Age group (years) | 1981 Census | 1986 Census | 1991 Census | 1996 Census | 2001 Census | 2006 Census | 2013 Census |
|---|---|---|---|---|---|---|---|
| 0–14 | 26.9 | 24.4 | 23.2 | 23.0 | 22.7 | 21.5 | 20.4 |
| 15–39 | 39.6 | 40.9 | 39.9 | 38.3 | 35.6 | 34.6 | 32.3 |
| 40–64 | 23.6 | 24.2 | 25.6 | 27.0 | 29.7 | 31.6 | 33.0 |
| 65–74 | 6.3 | 6.4 | 6.7 | 6.8 | 6.6 | 6.6 | 8.2 |
| 75 and over | 3.5 | 4.0 | 4.6 | 4.9 | 5.5 | 5.7 | 6.2 |
Source: Statistics New Zealand
The median age of New Zealand’s population increased from 25.6 years in 1970 to 37.5 years in 2014. The ageing of the population will continue, with a median age of 40 years likely to be reached in the early 2030s. This gradual ageing reflects the combined impact of people living longer and having fewer children, along with the large number of people born between 1950 and the early 1970s moving into the older ages.
The ethnic groups have different age profiles: Europeans had the median age of 41.0 years in 2013, compared with 22.1 years for Pacific peoples and 23.9 years for Māori.
Table P1.2 – Median age (years), by ethnic group, 2006 and 2013
| Ethnic group | 2006 Census | 2013 Census |
|---|---|---|
| European | 38.1 | 41.0 |
| Asian | 28.3 | 30.6 |
| MELAA | 26.6 | 28.6 |
| Māori | 22.7 | 23.9 |
| Pacific peoples | 21.1 | 22.1 |
Source: Statistics New Zealand
While the number of children in the population is expected to increase slowly (ie to 950,000 in the late 2030s and 970,000 in the late 2060s), the proportion of the population aged under 15 years is likely to decrease.
In comparison, the number of people aged 65 years and over is estimated to double by 2039, from 650,000 in 2014.
FertilityTop
In 2014, the total fertility rate in New Zealand was 1.92 births per woman, down from 2.01 births in 2013.
New Zealand’s total fertility rate has been relatively stable over the last three decades, averaging 2.03 births per woman. This is in contrast to the period from the mid-1940s to the 1960s when fertility was much higher, peaking at 4.31 births per woman in 1961.
In 2014, women aged 30–34 years had the highest age-specific fertility rate (119 births per 1,000 women), followed by women aged 25–29 years (102 births per 1,000 women). In comparison, the age–specific fertility rates for women aged 35–39 years and 20–24 years were much lower (67 births per 1,000 women and 62 births per 1,000 women respectively).
Those aged under 15 years had the lowest age-specific fertility rate of 0.2 births per 1,000 women in 2014, while the age-specific fertility rate for 15–19 year olds was 19 births per 1,000 women.
Figure P1.4 – Fertility rate, by age group, 1998–2014
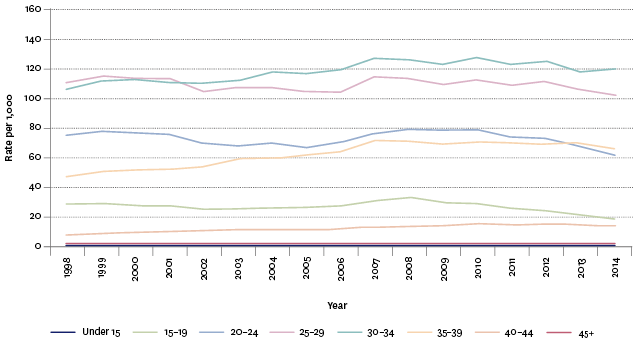
Source: Statistics New Zealand
Note: The rate for those aged under 15 years is around the same level as for those 45 years and over.
In 2014, Pacific women had the highest total fertility rate of 2.73 births per woman followed by Māori women with 2.49 births per woman. European women (1.92 births per woman) and Asian women (1.69 births per woman) had lower rates.
New Zealand’s total fertility rate in 2011 (2.06) was above the 2011 OECD median of 1.70, and higher than the 2011 rates for Australia (1.88), the United States (1.89) and Canada (1.61).
The median age of women giving birth in 2014 was 30.2 years. This median age has gradually increased over time – in 1962, it was 26.2 years. In addition, more women are remaining childless: in 2006, 15 percent of women aged 40–44 years were childless, compared with 12 percent of women in 1996 and 9 percent in 1981.
People born overseasTop
In 2013, 25.2 percent of people living in New Zealand were born overseas, a net increase of 303,159 people since the 2001 Census. The proportion of people born overseas has increased over time (it sat at 19.5 percent in 2001 and 22.9 percent in 2006).
In 2013, the most common countries of birth for people born overseas were England (21.5 percent), People’s Republic of China (8.9 percent), India (6.7 percent), Australia (6.3 percent), South Africa (5.4 percent), Fiji (5.3 percent), Samoa (5.1 percent), Philippines (3.7 percent), Korea (2.7 percent) and Scotland (2.6 percent).
From 2001 to 2013, there has been an increase in the proportions of people who were born in India, South Africa, Fiji and Philippines. Conversely there were decreases in the proportions of people living in New Zealand who were born in England, Australia, Samoa and Scotland.
Table P1.3 – Most common birthplace of overseas born, 2001–2013
| Birthplace | 2001 Census | 2006 Census | 2013 Census | |||
|---|---|---|---|---|---|---|
| Number | Percent | Number | Percent | Number | Percent | |
| England | 178,203 | 25.5 | 202,401 | 23.0 | 215,589 | 21.5 |
| People's Republic of China | 38,949 | 5.6 | 78,117 | 8.9 | 89,121 | 8.9 |
| India | 20,892 | 3.0 | 43,341 | 4.9 | 67,176 | 6.7 |
| Australia | 56,259 | 8.1 | 62,742 | 7.1 | 62,712 | 6.3 |
| South Africa | 26,061 | 3.7 | 41,676 | 4.7 | 54,276 | 5.4 |
| Fiji | 25,722 | 3.7 | 37,746 | 4.3 | 52,755 | 5.3 |
| Samoa | 47,118 | 6.7 | 50,649 | 5.8 | 50,661 | 5.1 |
| Philippines | 10,134 | 1.5 | 15,285 | 1.7 | 37,299 | 3.7 |
| Korea | 17,931 | 2.6 | 28,809 | 3.3 | 26,601 | 2.7 |
| Scotland | 28,680 | 4.1 | 29,016 | 3.3 | 25,953 | 2.6 |
Source: Statistics New Zealand
Auckland had the highest proportion of overseas-born people (39.1 percent in 2013, an increase from 37.0 percent in 2006). Gisborne (9.7 percent), Southland (10.2 percent) and the West Coast (11.0 percent) had the lowest proportions.
In 2013, less than half of those born in Asia and living in New Zealand had been in New Zealand for 10 years or more (47.4 percent). This compared with 67.6 percent of people who had been born in the United Kingdom/Ireland and 63.9 percent of Australian born.
In 2013, the median age for those born overseas was 41.8 years, compared with 36.2 years for people born in New Zealand.
Languages spokenTop
New Zealand has three “official” languages: English, Māori (from 1987) and New Zealand Sign Language (NZSL) (from April 2006).
In 2013, almost all people were able to speak English (96.1 percent) (ie could hold a conversation about everyday things). Those who could not speak English were most likely to be adults who were born overseas, identified with an Asian ethnicity, and lived in Auckland.
Much smaller proportions of New Zealanders could speak te reo Māori (3.7 percent), with one–quarter (24.6 percent) of those being children. In the 2013 Census, 21.3 percent of all Māori reported that they could hold a conversation in Māori about everyday things, a decrease from 2006 (23.7 percent) and 2001 (25.2 percent).
In 2013, less than 1 percent (0.5 percent) of the usually resident population could use NZSL. There has been a drop in the number of people who can use NZSL over time, from 28,000 in 2001 to 20,000 in 2013.
Approximately 6,000 people said they could communicate in all three of New Zealand’s official languages, a 6.3 percent drop from 2006.
After English and te reo Māori, the next most common languages spoken in New Zealand in 2013 were Samoan (2.2 percent), Hindi (1.7 percent), Northern Chinese (1.3 percent), French (1.2 percent) and Yue (1.1 percent). While the proportions of people speaking English stayed consistent over time, the proportions speaking Māori have decreased and proportions speaking Hindi and Northern Chinese have increased.
Table P1.4 – Most common languages spoken in New Zealand, 2001–2013
| Languages spoken | 2001 Census | 2006 Census | 2013 Census | |||
|---|---|---|---|---|---|---|
| Number | Percent | Number | Percent | Number | Percent | |
| English | 3,425,301 | 96.1 | 3,673,626 | 95.9 | 3,819,972 | 96.1 |
| Māori | 160,527 | 4.5 | 157,110 | 4.1 | 148,395 | 3.7 |
| Samoan | 81,036 | 2.3 | 85,428 | 2.2 | 86,403 | 2.2 |
| Hindi | 22,749 | 0.6 | 44,589 | 1.2 | 66,309 | 1.7 |
| Northern Chinese incl. Mandarin | 26,514 | 0.7 | 41,391 | 1.1 | 52,263 | 1.3 |
| French | 49,722 | 1.4 | 53,757 | 1.4 | 49,125 | 1.2 |
| Yue incl. Cantonese | 37,140 | 1.0 | 44,151 | 1.2 | 44,625 | 1.1 |
Source: Statistics New Zealand
The number of people who could speak more than one language has increased from 15.8 percent in 2001 to 18.6 percent in 2013.
Distribution of the populationTop
The 2006 Census showed that most people lived in an urban area (71.8 percent of people lived in a main urban area and 14.2 percent lived in other urban areas). Fourteen percent of people lived in a rural area.
In 2013, Auckland was the largest city in New Zealand (1,415,550) followed by Christchurch (341,469), Wellington (190,956), Hamilton (141,615), Dunedin (120,246) and Tauranga (114,615).
In 2013, all regional council areas either showed population growth or had steady populations, with the exception of Gisborne, which had a small decline. Auckland was the fastest-growing region, increasing its population share by 8.5 percent between 2006 and 2013 – 33.4 percent of the total population lived in the Auckland region in 2013. Nelson was the second fastest-growing region, up 8.3 percent, followed by Waikato (up 6.0 percent) – in 2013, 9.5 percent of the total population lived in the Waikato region and 1.1 percent lived in the Nelson region.
All South Island regions had higher proportions of people who identified with European ethnicities than any region in the North Island.
In 2013, Gisborne (48.9 percent) and Northland (32.4 percent) had the highest proportions of people identifying as Māori.
Auckland was the most common location for those identifying as Pacific (65.9 percent), Asian (65.1 percent) or MELAA (53.1 percent) to live in 2013.
Household and family compositionTop
Household composition
A household may contain a single person living alone, or two or more people who usually live together and share facilities as a family (a couple, parents with children), a group of families, a family with other people, or a group of individuals living together.
The number of New Zealand households has increased by 6.6 percent since 2006. In 2013, there were 1,549,890 households, up from 1,454,175 in 2006. Over two–thirds (68.3 percent) contained one family (with or without other people), down slightly from 69.1 percent in 2006.
In 2013, the average household size was 2.7 people per household, the same as in 2006. The average household size is projected to gradually decrease between 2013 and 2038, with the number of one-person households projected to increase.
Family composition
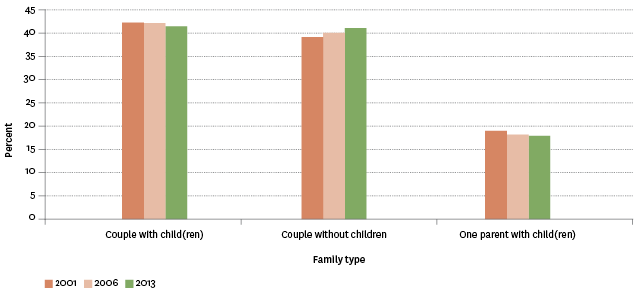
A couple with children (41.3 percent) was the most common family type in 2013, though this proportion has been decreasing since 1991, when these families made up 48.0 percent of New Zealand families. Couples without children were the second most common type (40.9 percent), with this proportion increasing since 1991 (34.8 percent). It is projected that couples without children will become the most common family type by 2038.
One parent with children families has decreased slightly from 18.9 percent in 2001 to 17.8 percent in 2013.
Figure P1.5 – Family type, 2001–2013
Source: Statistics New Zealand
Around six in ten families included children. Most families with children had one child (43.5 percent) or two children (36.7 percent). One in five had more children: 13.7 percent had three children while 6.1 percent had four or more children.
Most families with children included at least one dependent child (78.4 percent or 526,269 families). This is down from 80.4 percent in 2006.
In 2013, 91,000 families included dependent young people (aged 18–24 years, not employed full-time, and living with at least one parent). Of those, just over half were in full-time study, while 6.5 percent were studying part-time. Four in ten were employed part-time.
Parents with dependent children living in other householdsTop
Many parents who have separated from their spouse or partner have children living in another household. Because family statistics are household based, these parent-child relationships are not counted.
The 2010 New Zealand General Social Survey (NZGSS) found that 225,000 parents had either some or none of their children aged under 18 years living with them (15.0 percent of those who had children aged under 18 years). This included children they may spend time with or have to stay overnight.
Of these, most parents (87.1 percent) gave some form of support (eg clothing, child support payments for their children living outside the household). Three–fifths (60.8 percent) provided support to one child, 26.4 percent supported two children, 8.7 percent supported three children, and 4.0 percent supported four or more children.
Housing tenureTop
Home ownership by households
Half (49.9 percent) of New Zealand households owned or partly owned houses in 2013, down from 54.5 percent in 2006.
In 2013, 453,135 households (31.2 percent of total households) rented their home, up from 388,275 in 2006. Households that rented were most likely to be either one-family households (63.3 percent) or one-person households (23.5 percent).
Home ownership by individuals
Europeans were most likely to own or partly own their home (56.8 percent), compared with 34.8 percent of people in the Asian ethnic group, 28.2 percent of Māori and 18.5 percent of Pacific peoples.
Married people were most likely to own their home (75.1 percent), while people who had never been married or never been in a civil union were the least likely to own their home (12.3 percent).
Home ownership was highest for those aged 70–74 years (77.5 percent), compared with 60.8 percent for those in their forties and 43.0 percent for those in their thirties.
Table P1.5 – Proportion of home ownership, by age group, 2001–2013
| Age group (years) | 2001 Census | 2006 Census | 2013 Census |
|---|---|---|---|
| 15–19 | 1.5 | 2.3 | 1.7 |
| 20–24 | 6.2 | 6.7 | 4.7 |
| 25–29 | 26.4 | 22.9 | 18.4 |
| 30–34 | 47.7 | 43.6 | 36.0 |
| 35–39 | 61.0 | 56.6 | 49.6 |
| 40–44 | 69.1 | 64.8 | 57.9 |
| 45–49 | 74.3 | 70.5 | 63.8 |
| 50–54 | 77.9 | 74.8 | 68.4 |
| 55–59 | 79.3 | 78.0 | 72.1 |
| 60–64 | 79.3 | 79.1 | 74.9 |
| 65–69 | 80.2 | 79.3 | 77.3 |
| 70–74 | 80.6 | 79.5 | 77.5 |
| 75–79 | 78.7 | 78.4 | 75.9 |
| 80–84 | 72.6 | 74.5 | 73.1 |
| 85 and over | 55.4 | 59.0 | 60.4 |
| Total people | 54.9 | 53.2 | 49.8 |
Source: Statistics New Zealand
ReligionTop
In 2013, 48.9 percent of people stated that their religion was affiliated with a Christian religion, down from 55.6 percent in 2006. The largest Christian denominations were Catholic (492,000), Anglican (460,000), and Presbyterian, Congregational and Reformed (331,000). There have been large increases in people affiliating with the Sikh, Hindu and Islam religions. Between 2006 and 2013, Sikhism more than doubled, while Hinduism increased by 39.6 percent and the number of Muslims increased by 27.9 percent. Numbers affiliated with these religions remained relatively small, however.
The proportion of people indicating that they have no religion increased over time (29.6 percent in 2001; 34.6 percent in 2006; and 41.9 percent in 2013).
New Zealanders experiencing disabilityTop
In 2013, 24 percent of the New Zealand population identified as disabled, a total of 1.1 million people. Disability is defined as an impairment that has a long-term (six months or longer) limiting effect on a person’s ability to carry out day-to-day activities.
People aged 65 years or over were much more likely to be disabled (59 percent), compared with those aged 15–65 years (21 percent) or children under 15 years (11 percent). Ageing has an impact on the disability rates, particularly for physical impairments.
Māori (32 percent) and Pacific peoples (26 percent) had higher-than-average disability rates, after adjusting for differences in ethnic population age profiles. Europeans (24 percent) had a slightly lower rate than Pacific peoples, while the rate for the Asian ethnic group was 17 percent.
Physical limitations were the most common type of impairment (14 percent), followed by sensory impairments (11 percent – hearing and vision loss that hearing aids and glasses do not eliminate) and psychological/psychiatric impairment (5 percent). Among children, learning difficulties were most common.
Just over half of all disabled people (53 percent) had more than one type of impairment.
The most common cause of disability for adults was disease or illness (42 percent), followed by accident/injury (34 percent) and ageing (31 percent). A condition that existed at birth was the most common cause of disability for children (49 percent), followed by other causes such as autism and developmental delay (33 percent).
Gay, lesbian, bisexual and transgender peopleTop
There is little population information based on sexual orientation or gender identity in New Zealand, and little reliable data on the size of gay, lesbian, bisexual and transgender populations.
Some information on same-sex couples who share a residence had been collected in censuses since 1996. The 2013 Census recorded 8,328 same-sex couples; 0.9 percent of all couples (3,672 were male couples and 4,656 were female couples). Most same-sex couples did not have children (6,852, compared with 1,476 who had children).
Other information is collected in the national health and wellbeing survey of secondary school students. The 2012 survey found that 92 percent of secondary students were exclusively attracted to the opposite sex, while 4 percent were attracted to the same sex or both sexes and 4 percent were not sure or were attracted to neither sex. About 1 percent of students reported that they were transgender, while 3 percent were unsure. These proportions are the same as in previous surveys in 2000 and 2007.
Data for this section can be found at: www.socialreport.msd.govt.nz/documents/2016/p.xlsx
