Life satisfaction
Overall life satisfaction
Definition
The proportion of the population aged 15 years and over who rated their overall life satisfaction highly.
RelevanceTop
Overall life satisfaction is an indicator of subjective wellbeing. A number of circumstances may influence overall life satisfaction, such as health; education; employment; income; personality; family and social connections; civil and human rights; levels of trust and altruism; and opportunities for democratic participation.
Current levelTop
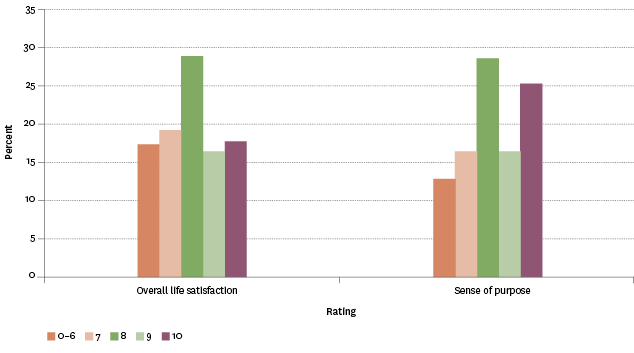
In the survey, people were also asked about their sense of purpose: a higher proportion of the population (87.1 percent) felt that the things they did in their life were worthwhile (ie gave a rating of 7 or above on a 0–10 scale, with 0 being not at all worthwhile and 10 being completely worthwhile).
Figure LS1.1 – Proportion of population aged 15 years and over by ratings of
overall life satisfaction and sense of purpose, 2014
Source: Statistics New Zealand, New Zealand General Social Survey
Age and sex differencesTop
Males and females had similar levels of life satisfaction. In 2014, 83.4 percent of males rated their life satisfaction highly, compared with 81.8 percent of females.
Those aged 65 years and over had the highest levels of life satisfaction (85.9 percent), with one–third (31.5 percent) rating their satisfaction as 10 out of 10. In comparison, those aged 45–54 years had the lowest levels of life satisfaction (80.2 percent), with only 13.1 percent of this age group rating their satisfaction as 10 out of 10.
Table LS1.1 – Proportion of population aged 15 years and over by ratings of
overall life satisfaction, by age group, 2014
| Age group | 0–6 | 7 | 8 | 9 | 10 | Combined 7–10 |
|---|---|---|---|---|---|---|
| 15–24 | 16.7 | 21.6 | 30.3 | 16.4 | 15.0 | 83.3 |
| 25–34 | 17.9 | 22.5 | 31.4 | 15.6 | 12.5 | 82.1 |
| 35–44 | 17.7 | 23.2 | 28.4 | 17.5 | 13.1 | 82.3 |
| 45–54 | 19.8 | 19.0 | 31.1 | 17.0 | 13.1 | 80.2 |
| 55–64 | 18.5 | 16.9 | 28.7 | 14.7 | 21.1 | 81.5 |
| 65+ | 14.1 | 12.4 | 24.4 | 17.7 | 31.5 | 85.9 |
| Total | 17.4 | 19.3 | 29.0 | 16.5 | 17.8 | 82.6 |
Source: Statistics New Zealand, New Zealand General Social Survey
Ethnic differencesTop
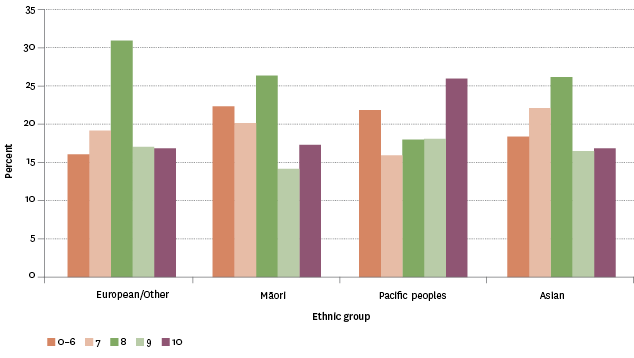
In 2014, those who identified as European/Other had the highest reported life satisfaction (84.0 percent rating their satisfaction at 7 or above), followed by people in the Asian ethnic group (81.6 percent). Māori (77.8 percent) and Pacific peoples (78.1 percent) were slightly less likely to rate their overall life satisfaction highly.
Pacific peoples had the highest proportion of people rating their overall life satisfaction at 10 out of 10 (25.9 percent), compared with 17.3 percent of Māori and 16.9 percent each for European/Other and those in the Asian ethnic group.
Figure LS1.2 – Proportion of population aged 15 years and over by ratings of
overall life satisfaction, by ethnic group, 2014
Source: Statistics New Zealand, New Zealand General Social Survey
Socio-economic differencesTop
The proportion of people who rated their overall life satisfaction highly increases as their material wellbeing increases. In 2014, 92.4 percent of people in the higher material wellbeing index category were satisfied with their lives, compared with 62.1 percent of people in the lower material wellbeing index category. The satisfaction levels for people in the lower middle material wellbeing index category and upper middle category were 78.3 percent and 85.5 percent respectively.
Table LS1.2 – Proportion of population aged 15 years and over by ratings of
overall life satisfaction, by Material Wellbeing Index, 2014
| MWI category | 0–4 | 5 | 6 | 7–10 |
|---|---|---|---|---|
| Lower | 12.7 | 15.0 | 10.2 | 62.1 |
| Lower middle | 3.4 | 9.8 | 8.5 | 78.3 |
| Upper middle | 2.8 | 4.8 | 6.9 | 85.5 |
| Higher | 1.2 | 2.7 | 3.7 | 92.4 |
| Total | 4.0 | 6.8 | 6.7 | 82.6 |
Source: Statistics New Zealand, New Zealand General Social Survey
A similar pattern was found when looking at personal income: 92.5 percent of people with a personal income over $70,000 rated their life satisfaction highly, compared with 78.3 percent of those with a personal income of $30,000 and under, and 84.0 percent of those with a personal income between $30,001 and $70,000.
Labour force status differencesTop
In 2014, those who were employed (84.4 percent) and those not in the labour force (eg retired, studying, caring for others (80.0 percent)) were more satisfied with their lives compared with those who were unemployed (70.5 percent).
Family type differencesTop
Couples were more likely to be satisfied than other family types. In 2014, people living in a couple with children and people living in a couple without children (85.2 percent and 87.4 percent respectively) were more satisfied with their lives, compared with 76.7 percent for people not in a family nucleus and sole-parent families (69.6 percent).
Migrant status differencesTop
In 2014, 88.2 percent of migrants who had arrived in New Zealand in the past five years rated their life satisfaction highly, compared with 82.2 percent of longer-term migrants and 82.4 percent of people born in New Zealand.
Regional differencesTop
Taranaki (86.9 percent) and Waikato (85.0 percent) had the highest proportions of people who rated their life satisfaction highly. Manawatu-Wanganui (78.7 percent) and Northland (80.2 percent) had the lowest proportions.
International comparisonTop
OECD comparisons can be made by looking at the average score for life satisfaction for OECD countries in 2014 or the latest available year.
New Zealand (7.3) was above the OECD median of 6.9. New Zealand had the same average score as Australia and Canada, but was higher than the United States (7.2) and the United Kingdom (6.8). Denmark, Iceland and Switzerland each had the highest score of 7.5, while Greece (4.8) and Hungary (4.9) had the lowest average scores.
Data for this section can be found at: www.socialreport.msd.govt.nz/documents/2016/ls1.xlsx
