Paid work
Work-related injury
Definition
The age-standardised rate of serious non-fatal work-related injury per 100,000 person-years at risk.
RelevanceTop
Current level and trendsTop
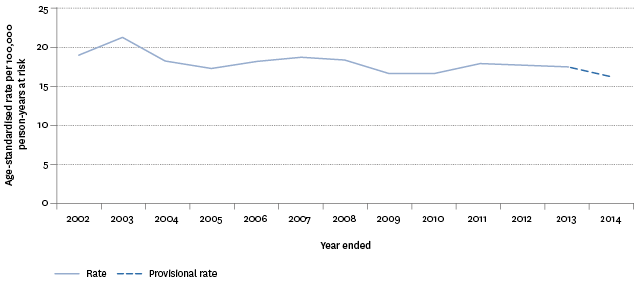
Provisional data for the year ended 2014 indicates the age-standardised rate for serious non-fatal work-related injury was 16.2 per 100,000 person-years at risk, a lower rate than the previous year (17.4 per 100,000 person-years at risk). The number of seriously injured workers was estimated at 397 in 2014.
Over the last 10 years, the age-standardised rate for serious non-fatal work-related injury has generally been decreasing but has been more stable over the last five years.
Figure PW4.1 – Age-standardised rate of serious non-fatal work-related injury,
2002–2014

Source: Statistics New Zealand
Note: The 2014 data is provisional and subject to change.
On average across the period 2012–2014, there were 52 fatal work-related injuries, a rate of 2.2 per 100,000 person-years at risk.
Age and sex differencesTop
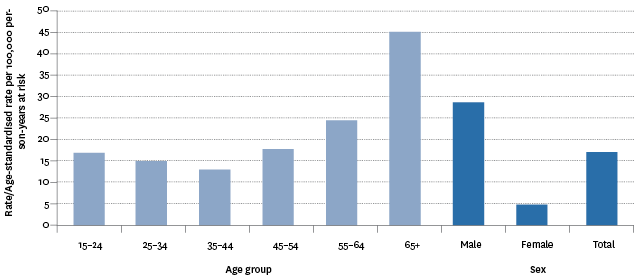
There has been a steady increase in the number of serious non-fatal work-related injuries for those aged 65 years and over (60 in 2014), and they consistently have the highest rate (45 per 100,000 person-years at risk on average over 2012–2014). In general, older workers 45 years of age and over have higher rates and numbers of work-related injuries.
Males are far more likely to experience serious non-fatal work-related injury. Over the period 2012–2014, the provisional male rate for serious non-fatal work-related injuries was 29.0 per 100,000 person-years at risk, compared with 5.0 per 100,000 person-years at risk for females.
Figure PW4.2 – Age-specific and age-standardised rate of serious non-fatal work-related
injury, by age group and sex, 2012/2014

Source: Statistics New Zealand, Ministry of Social Development
Notes: Rates by age are age-specific; rates by sex and total are age-standardised. Rates for serious injury for age groups, sex and total used in this chart are based on a three year average for 2012/2014.
Ethnic differencesTop
Limited ethnic data is available for serious non-fatal work-related injury because of the small numbers involved. However, available data shows Māori had a significantly higher rate than workers overall across the period 2012–2014 (22.0 and 17.1 per 100,000 workers respectively).
Larger numbers of ACC work-related injury claims provide a richer picture of ethnic outcomes and show rates were higher for the Other ethnic group and Pacific peoples in 2014 (155 and 106 per 1,000 full-time equivalents (FTEs) respectively, compared with 57 per 1,000 FTEs for the Asian ethnic group).
Table PW4.1 – Work-related ACC injury claims and serious injuries,
by ethnic group, 2014
| Ethnic group | Number of claims (2014) | Rate per 1,000 FTEs | Number of serious injuries (2014 – see notes) | Age-standardised rate per 100,000 person-years at risk |
|---|---|---|---|---|
| European | 135,000 | 89 | .. | .. |
| Māori | 23,100 | 97 | 56 | 22.0 |
| Pacific peoples | 10,800 | 106 | .. | .. |
| Asian | 14,300 | 57 | .. | .. |
| Other | 9,200 | 155 | .. | .. |
| Not specified | 39,000 | .. | .. | .. |
| Non-Māori | 203,000 | 113 | .. | .. |
| Total | 226,100 | 111 | 394 | 17.1 |
Source: Statistics New Zealand
Notes: Age-standardised rates and numbers for serious injury for Māori, non-Māori and total used in this table are based on a three-year average for 2012–2014.
Industry and occupation differencesTop
The agriculture, forestry and fishing industry had the highest rate of work-related injury claims in 2014 (a rate of 209 per 1,000 FTEs). The arts and recreation services industry had the next highest rate, followed by the construction industry and the manufacturing industry (rates of 201, 172 and 166 per 1,000 FTEs respectively). The information media and telecommunications industry had the lowest work-related injury claim rate (a rate of 19 per 1,000 FTEs).
Agriculture and fishery workers had the highest rate of work-related injury claims in 2014 (a rate of 242 per 1,000 FTEs). Elementary occupations had the next highest rate, followed by the trades workers, and plant and machine operators and assemblers (rates of 238, 209 and 197 per 1,000 FTEs respectively). Clerks had the lowest work-related injury claim rate (a rate of 35 per 1,000 FTEs).
Regional differencesTop
Gisborne/Hawke's Bay had the highest rate of work-related injury claims in 2014 (a rate of 159 per 1,000 FTEs). Northland had the next highest rate, followed by Manawatu-Wanganui and Tasman/Nelson/Marlborough/West Coast (rates of 141, 137 and 136 per 1,000 FTEs respectively). Wellington had the lowest work-related injury claim rate (a rate of 72 per 1,000 FTEs).
Data for this section can be found at: www.socialreport.msd.govt.nz/documents/2016/PW4.xlsx

