Knowledge and skills
Participation in early childhood education
Definition
The proportion of children who participated in, or are enrolled or attending, early childhood education.
RelevanceTop
The headline measure uses prior participation in early childhood education (ECE) for children starting school. The second measure uses enrolment rates in early childhood education.
1. Prior participation of Year 1 studentsTop
Current level and trendsTop
At June 2014, 95.9 percent of children starting school had attended early childhood education, slightly above the 2013 rate (95.6 percent).
There have been steady increases in early childhood education participation since June 2000, when the rate was 90 percent of children starting school, 5.9 percentage points lower than in June 2014.
Figure K1.1 – Proportion of children starting school who attended early
childhood education, 2000–2014
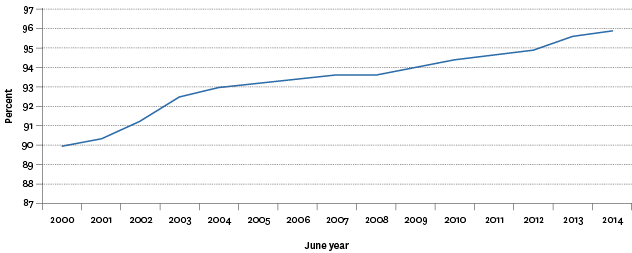
Source: Ministry of Education
Sex differencesTop
Based on prior participation figures, there were no significant differences between males and females (95.6 and 96.0 percent respectively in 2014).
Ethnic differencesTop
In 2014, there were ethnic differences in the proportion of children starting school who had attended early childhood education. European children had the highest proportion at 98.1 percent, followed by the Asian ethnic group (97.0 percent). Pacific children had the lowest proportion at 90.3 percent, followed by Māori (92.9 percent) and Other ethnic groups (94.7 percent).
There have also been variations in changes over time by ethnicity. For the European, Asian and Other ethnic groups, substantive gains were made from 2000 to 2007, but improvements have since slowed as rates approach 100 percent. For Pacific and Māori children, there has been continued improvement including significant gains from 2000 to 2007, and further gains from 2007 to 2014 following the introduction of 20 hours free ECE in 2007.
Table K1.1 – Proportion of children starting school who attended early
childhood education, by ethnic group, 2000–2014
| Year | European | Māori | Pacific peoples | Asian | Other ethnic groups | Total |
|---|---|---|---|---|---|---|
| 2000 | 94.2 | 83.1 | 75.8 | 89.2 | 82.2 | 90.0 |
| 2001 | 94.9 | 83.6 | 76.0 | 89.8 | 83.3 | 90.3 |
| 2002 | 95.5 | 84.8 | 79.1 | 92.1 | 85.7 | 91.2 |
| 2003 | 96.2 | 86.7 | 83.1 | 92.4 | 88.0 | 92.5 |
| 2004 | 96.4 | 87.5 | 84.4 | 94.1 | 88.5 | 93.0 |
| 2005 | 96.5 | 88.1 | 84.2 | 95.1 | 89.1 | 93.2 |
| 2006 | 96.9 | 88.1 | 83.8 | 96.0 | 90.8 | 93.4 |
| 2007 | 97.0 | 88.8 | 83.6 | 96.0 | 92.7 | 93.6 |
| 2008 | 97.2 | 88.7 | 84.4 | 95.3 | 92.9 | 93.6 |
| 2009 | 97.3 | 89.6 | 85.1 | 95.6 | 93.9 | 94.0 |
| 2010 | 97.6 | 89.4 | 85.9 | 95.9 | 95.4 | 94.4 |
| 2011 | 97.8 | 90.1 | 86.1 | 95.8 | 95.4 | 94.6 |
| 2012 | 97.9 | 90.9 | 86.7 | 95.8 | 95.4 | 94.9 |
| 2013 | 98.2 | 92.3 | 88.5 | 96.8 | 94.6 | 95.6 |
| 2014 | 98.1 | 92.9 | 90.3 | 97.0 | 94.7 | 95.9 |
Source: Ministry of Education
Note: Ethnicity is total response.
Socio-economic differencesTop
Regional differencesTop
In 2014, Nelson, Otago, Canterbury and Tasman performed consistently well in terms of the proportion of children starting school who had attended early childhood education (99.0, 98.4, 98.2 and 97.1 percent respectively). Three regions consistently performed less well: Northland, Auckland and Gisborne (91.0, 94.8 and 95 percent respectively).
2. Enrolments (attendances)Top
Current level and trendsTop
Enrolment data allows for results to be provided by age. Changes to the method of collecting data, however, means 2014 data should not be compared with previous data, making short-term time series analysis problematic. However, data still allows for longer-term trends to be reported.
The most common ages for children to attend early childhood education is at 3 and 4 years. In 2014, 93.1 percent of 3 year olds and 97.1 percent of 4 year olds attended early childhood education (95.1 percent for 3 and 4 year olds combined). This compares with 44.2 percent of 1 year olds and 64.5 percent of 2 year olds.
When comparing changes in early childhood education enrolments for children aged 3 and 4 years with children aged 1 and 2 years, there are marked differences. Between 2000 and 2013, there was a 14.8 percentage point increase in those aged 1 and 2 years enrolled in early childhood education. This compares with a 6.0 percentage point increase for children aged 3 and 4 years.
Further reflecting changes in early childhood education activity is the time that children aged 0–5 years spend in education per week. The average number of hours per enrolment per week rose from 13.5 hours in 2000 to 21.7 hours in 2013 (up 8.2 hours).
Enrolment by service typeTop
Figure K1.2 – Proportion of children aged 3 and 4 attending early childhood education,
by service type, 2000–2014
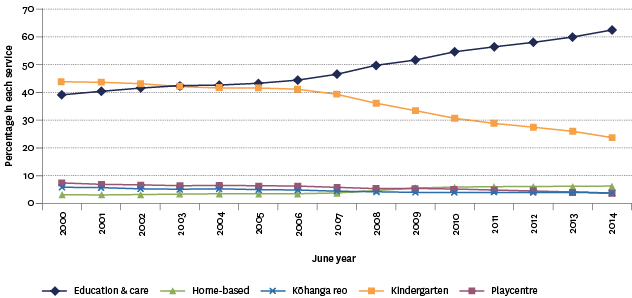
Source: Ministry of Education
International comparisonTop
Using 2012 data sourced from the OECD, New Zealand ranked 12th out of 33 OECD countries for enrolment rates of 3–4 year olds (91 percent). This was above the OECD median of 86 percent, and compares with 95 percent in the United Kingdom, 52 percent in the United States and 47 percent in Australia. France and Belgium shared the top spot at 99 percent, and Turkey the lowest at 12 percent.
Data for this section can be found at: www.socialreport.msd.govt.nz/documents/2016/k1.xlsx
