Social connectedness
Loneliness
Definition
The proportion of the population aged 15 years and over who reported feeling lonely “all of the time”, “most of the time”, or “some of the time” in the last four weeks.
RelevanceTop
Social contact is fundamentally important to people: humans are social creatures. Self-assessed loneliness is an indicative indicator of whether people are happy with the amount and quality of social contact they have. As well as being an undesirable state in itself, loneliness may also contribute to poor outcomes in other areas including adverse health problems such as stress, anxiety or depression.
Current levelTop
Of the people who reported feeling lonely, 1.4 percent said they were lonely all of the time, 2.2 percent said they were lonely most of the time and 10.3 percent said they were lonely some of the time. A further 22.2 percent reported feeling lonely a little of the time, while 63.9 percent said they were not lonely at all in the last four weeks.
Figure SC5.1 – Levels of loneliness experienced by the population aged 15 years
and over during the last four weeks, 2014
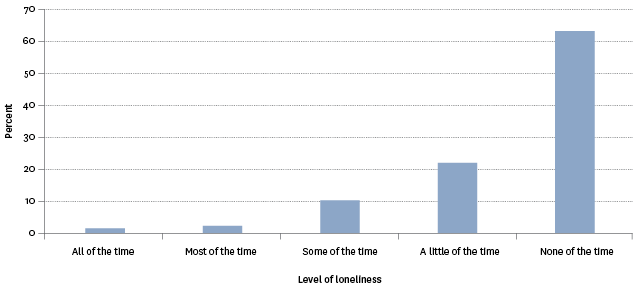
Source: Statistics New Zealand, New Zealand General Social Survey
Age and sex differencesTop
In general, loneliness decreases as age increases. Those aged 15–24 years had the highest levels of loneliness (16.8 percent), while those aged 65–74 had the lowest levels (9.6 percent).
In 2014, females (15.6 percent) were more likely than males (12.1 percent) to report feeling lonely sometimes, most of the time, or always, during the last four weeks.
Figure SC5.2 – Proportion of population who reported feeling lonely all, most or
some of the time during the last four weeks, by sex and age group, 2014
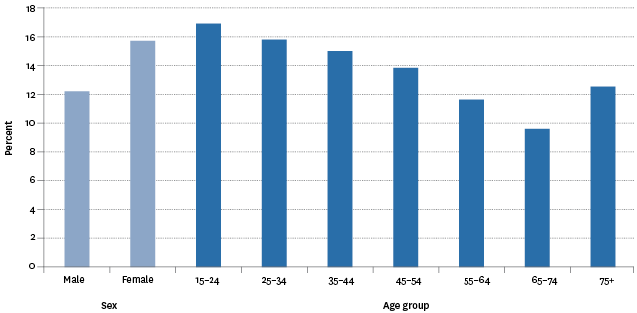
Source: Statistics New Zealand, New Zealand General Social Survey
Ethnic differencesTop
Ethnic groups reported similar rates of loneliness in 2014. Those in the European/Other group had a reported rate of 13.2 percent, which was similar to the rate for Pacific peoples (13.5 percent). The rates for Māori and those in the Asian ethnic group were 16.6 percent and 16.7 percent respectively.
Socio-economic differencesTop
In 2014, levels of reported loneliness declined as personal income rose. People with personal incomes of $30,000 or less (17.6 percent) had double the rate of loneliness of those with incomes over $70,000 (8.8 percent). The rate for those with personal incomes between $30,001 and $70,000 was 11.3 percent.
There is a similar pattern with material wellbeing. People in the lower material wellbeing index category (27.1 percent) reported higher levels of loneliness than people in the higher material wellbeing index category (6.6 percent). Those in the upper middle and lower middle categories had rates of 12.9 percent and 17.4 percent respectively.
Figure SC5.3 – Proportion of population who reported feeling lonely all, most or
some of the time during the last four weeks, by personal income and Material
Wellbeing Index, 2014
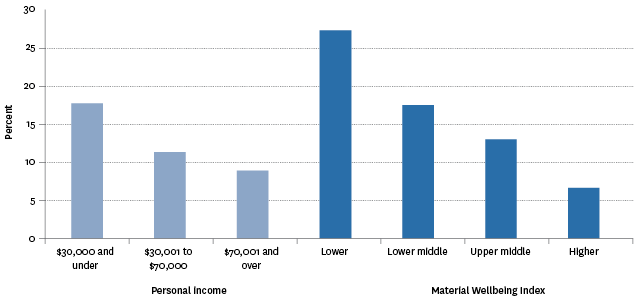
Source: Statistics New Zealand, New Zealand General Social Survey
Labour force status differencesTop
In 2014, unemployed people (22.7 percent) were more likely to report feeling lonely in the last four weeks, compared with employed people (12.1 percent) and those not in the labour force (16.9 percent).
Family type differencesTop
People who lived in sole-parent households with one or more children (25.6 percent) were more likely to report feeling lonely in the last four weeks than people who lived as couples with or without children (11.9 percent and 9.5 percent respectively). People not living in a family nucleus (18.9 percent) were more likely than people living as couples to report feeling lonely.
Figure SC5.4 – Proportion of population who reported feeling lonely all,
most or some of the time during the last four weeks, by family type, 2014
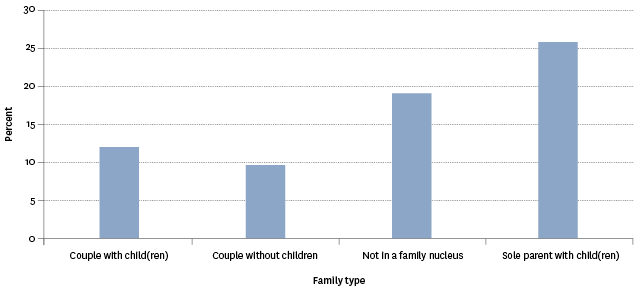
Source: Statistics New Zealand, New Zealand General Social Survey
Migrant status differencesTop
Migrants who had arrived in New Zealand less than five years ago (16.9 percent), longer-term migrants (15.2 percent) and those born in New Zealand (13.4 percent) reported similar rates of loneliness in 2014.
Regional differencesTop
In 2014, people living in Northland had the highest reported rates of loneliness (17.7 percent), followed by Otago (16.9 percent). There was not much variation between regions in the rest of New Zealand. People living in the Tasman/Nelson/Marlborough/West Coast region had the lowest rates of loneliness (12.7 percent), while the other regions had rates between 12.9 percent and 14.2 percent.
Data for this section can be found at: www.socialreport.msd.govt.nz/documents/2016/sc5.xlsx
