Civil and political rights
Perceived discrimination
Definition
The proportion of the population aged 15 years and over who reported they had been discriminated against in the past 12 months.
RelevanceTop
Freedom from unlawful discrimination is a core principle of democratic societies. Discrimination limits people's opportunities to participate fully in social and economic life, and has negative effects on mental and physical wellbeing.
Current levelTop
Of the people who reported being discriminated against, the most common situations in which this discrimination occurred were at work (33.5 percent) and in a public place or on the street (30.2 percent). This was followed by when in a shop or restaurant (18.3 percent), and when trying to get a job (15.0 percent).
The reasons people gave for being discriminated against included their race or ethnic group (35.5 percent), their age (19.4 percent), their skin colour (19.1 percent) or their gender (16.5 percent). Other reasons cited included their dress or appearance (13.7 percent), their disability or health issue (9.5 percent), their accent or language (9.0 percent), or their religious beliefs (6.5 percent). Only 1.9 percent of people cited their sexual orientation as a reason for the discrimination.
Age and sex differencesTop
Younger people were slightly more likely than older people to report being discriminated against. Those aged 25–34 years had the highest rate of perceived discrimination (21.5 percent) followed by those aged 15–24 years (20.7 percent). This compares with 18.8 percent of 35–44 year olds, 19.0 percent of 45–54 year olds and 14.7 percent of 55–64 year olds. Those aged 65 years and over had the lowest rate of perceived discrimination (7.8 percent).
Unsurprisingly, younger people were more likely to say they were discriminated against at school (27.8 percent of those aged 15–24 years compared with less than 10 percent for all other age groups). Those aged 65–74 years were more likely to say they were discriminated against at a medical centre (15.4 percent compared with between 5.0 percent and 10.3 percent for all other age groups). Perceived discrimination at work increased with age, peaking at 42.3 percent for those aged 45–54 years, before declining again after age 54.
Females (19.3 percent) were more likely than males (14.8 percent) to report being discriminated against. Although there were not large differences about where the discrimination occurred, females were more likely than males to cite gender as a reason for the discrimination (22.8 percent of females, compared with 7.7 percent of males). Males, on the other hand, were more likely to cite skin colour (23.1 percent of males, compared with 16.1 percent of females).
Figure CP4.1 – Proportion of population aged 15 years and over who reported they
had been discriminated against in the last 12 months, by sex and age group, 2014
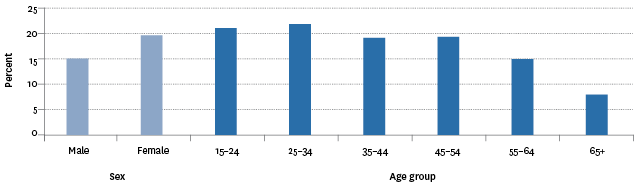
Source: Statistics New Zealand, New Zealand General Social Survey
Ethnic differencesTop
Māori (25.8 percent) and people in the Asian ethnic group (26.6 percent) were more likely to report being discriminated against than Pacific peoples (19.9 percent) and European/Others (14.7 percent). Of those that had experienced discrimination, Pacific peoples were more likely than other ethnic groups to report being discriminated against in a public place or on the street (47.6 percent, compared with 38.7 percent of Māori, 38.0 percent of Asian people and 25.4 percent of those in the European/Other group).
Race or ethnic group was the most common reason given for discrimination by the Asian ethnic group (79.8 percent), Māori (49.0 percent) and Pacific peoples (45.5 percent), while age was the most common response from those in the European/Other group (25.4 percent).
Figure CP4.2 – Reasons given by those who had reported they had been discriminated
against in the last 12 months, by ethnic group, 2014
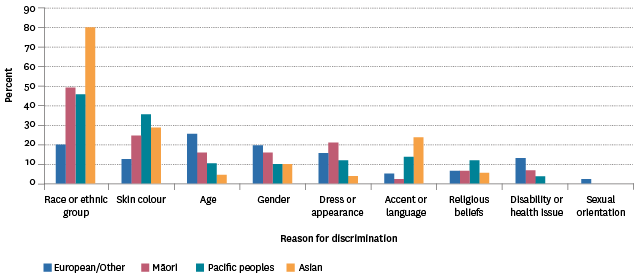
Source: Statistics New Zealand, New Zealand General Social Survey
Note: The question allows multiple responses so totals do not add up to 100 percent.
Socio-economic differencesTop
People with personal incomes of $30,000 or less (17.7 percent) and incomes of between $30,001 and $70,000 (17.8 percent) were more likely than people with incomes of over $70,000 (13.6 percent) to say they had been discriminated against.
A third (33.0 percent) of people who were in the lower material wellbeing index category reported being discriminated against, compared with just 9.2 percent of those in the higher material wellbeing index category and 13.4 percent of those in the upper middle material wellbeing index category. Those in the lower middle material wellbeing index category had a rate of 23.1 percent.
Figure CP4.3 – Proportion of population aged 15 years and over who reported they
had been discriminated against in the last 12 months, by personal income and
Material Wellbeing Index, 2014
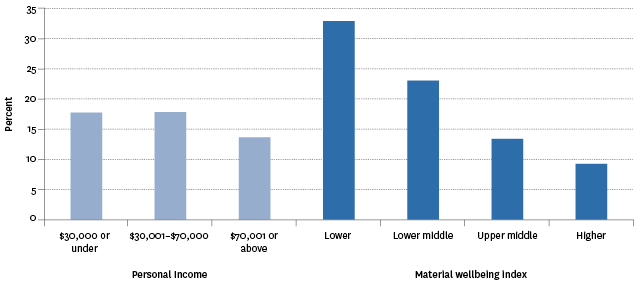
Source: Statistics New Zealand, New Zealand General Social Survey
Labour force status differencesTop
In 2014, unemployed people (33.8 percent) were more likely than employed people (17.5 percent) and those not in the labour force (14.0 percent) to report being discriminated against.
Family type differencesTop
Those in sole-parent families (25.1 percent) were more than twice as likely to report being discriminated against as people living in a couple with no children (11.4 percent). The rate for people living in a couple with children family was 18.9 percent and the rate for those not in a family nucleus was 18.0 percent.
Migrant status differencesTop
In 2014, people born in New Zealand (16.4 percent) reported similar levels of discrimination to longer-term migrants (19.0 percent) and migrants who arrived in New Zealand within the last five years (17.7 percent).
Regional differencesTop
Northland had the highest rate of reported discrimination (25.1 percent), followed by Bay of Plenty and Manawatu-Wanganui (both 19.3 percent). Taranaki (11.4 percent) and Southland (11.5 percent) had the lowest rates.
International comparisonTop
In the 2012 European Commission on discrimination in the European Union (EU), 17 percent of respondents reported personal experience of discrimination in the past year on one or more of the six grounds legally prohibited in the EU: gender, ethnic origin, religion or beliefs, age, disability, and sexual orientation. This is similar to New Zealand’s rate of 17.1 percent. Europeans who belonged to a minority group were more likely than Europeans on average to report that they had personally experienced discrimination.
Data for this section can be found at: www.socialreport.msd.govt.nz/documents/2016/cp4.xlsx
