Paid work
Job satisfaction
Definition
The proportion of employed people who were “very satisfied” or “satisfied” with their job.
RelevanceTop
Job satisfaction reflects how people feel about their job and encompasses a range of possible factors and influences. Job satisfaction has been associated with overall life satisfaction and provides an additional view on working life.
Current level and trendsTop
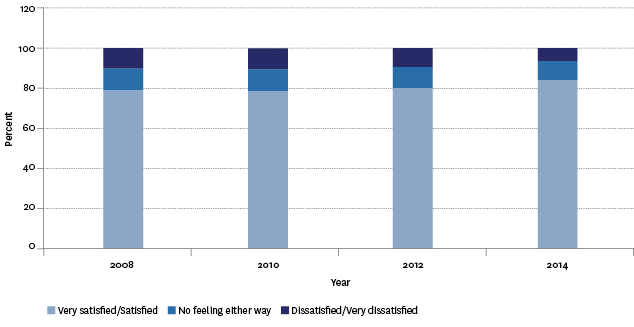
In the 2014 New Zealand General Social Survey (NZGSS), 84.0 percent of employed people, when asked about how they felt about their job, were very satisfied or satisfied. Of these, 35.6 percent were very satisfied and 48.3 percent were satisfied. Over the four biennial NZGSS surveys conducted from 2008, statistically there has been no real change in the proportion who said they were very satisfied and satisfied but there is a clear upward trend since 2010 (78.5 percent in 2010 and 80.1 percent in 2012). There was also a significant drop in those dissatisfied or very dissatisfied, however, with the proportion moving from 10.2 percent in 2008 to 6.5 percent in 2014.
Figure PW5.1 – Proportion of employed people by level of job satisfaction, 2008–2014

Source: Statistics New Zealand, New Zealand General Social Survey
Age and sex differencesTop
In the 2014 survey, there was little difference between males and females regarding those who were very satisfied or satisfied with their jobs (83.6 and 84.4 percent respectively). However, over the four surveys conducted, females had, on average, slightly higher proportions than males who were very satisfied or satisfied with their job.
Over the four survey periods, those in the younger age groups were proportionately less likely than older age groups to be very satisfied or satisfied with their job. In the 2014 survey, 25–34 year olds, followed by 15–24 year olds, were least likely to be very satisfied or satisfied with their job (81.6 and 82.2 percent respectively). The 65–74 year age group, followed by 55–64 year olds, were proportionately most likely to be very satisfied or satisfied with their job (88.0 and 87.2 percent respectively).
Table PW5.1 – Proportion of employed people who were very satisfied or satisfied
with their job, by age group and sex, 2008–2014
| Year | 15–24 | 25–34 | 35–44 | 45–54 | 55–64 | 65–74 | Male | Female | Total |
|---|---|---|---|---|---|---|---|---|---|
| 2008 | 72.8 | 76.0 | 78.3 | 79.7 | 85.4 | 91.5 | 77.7 | 80.3 | 78.9 |
| 2010 | 67.5 | 77.1 | 78.4 | 81.2 | 83.9 | 89.1 | 78.0 | 79.1 | 78.5 |
| 2012 | 75.1 | 79.2 | 77.8 | 81.7 | 82.1 | 91.2 | 80.6 | 79.4 | 80.1 |
| 2014 | 82.2 | 81.6 | 84.4 | 82.9 | 87.2 | 88.0 | 83.6 | 84.4 | 84.0 |
Source: Statistics New Zealand, New Zealand General Social Survey
Note: The 75+ age group has been excluded because of the level of sampling error.
Ethnic differencesTop
Only small differences were found between ethnic groups in terms of the proportion very satisfied or satisfied with their job.
Socio-economic differencesTop
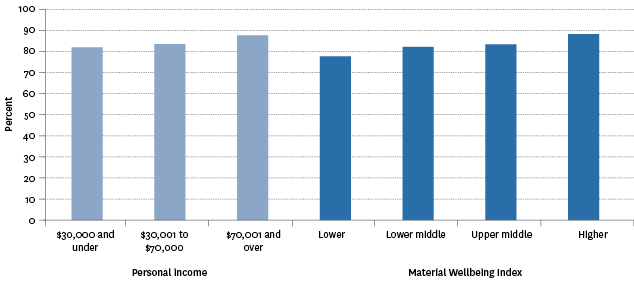
Figure PW5.2 – Proportion of employed people who were very satisfied or satisfied with
their job, by personal income and Material Wellbeing Index, 2014

Source: Statistics New Zealand, New Zealand General Social Survey
Family type differencesTop
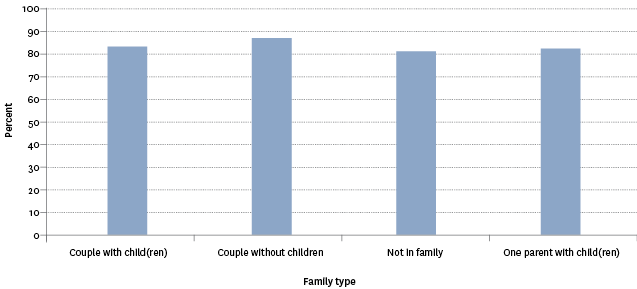
There is a consistent pattern across survey periods with regard to family type. People who lived in a couple without children were proportionately most likely to be very satisfied or satisfied with their job (87.0 percent in 2014), followed by people who lived in a couple with children (83.3 percent). Those not in a family nucleus were least likely to be very satisfied or satisfied with their job (81.2 percent), followed by those in sole-parent families (82.4 percent).
Figure PW5.3 – Proportion of employed people who were very satisfied or satisfied with
their job, by family type, 2014

Source: Statistics New Zealand, New Zealand General Social Survey
Regional differencesTop
The proportion of those who are very satisfied or satisfied with their job shows little variation across regions.
International comparisonTop
The most recent and comparable data from the OECD in 2005 showed that 80.7 percent of New Zealanders said they were completely, very or fairly satisfied with their job. This was slightly below the OECD median across 21 countries of 81.1 percent, and compares with 80.5 percent for Australia, 81.6 percent for the United Kingdom and 82.2 percent for the United States.
Data for this section can be found at: www.socialreport.msd.govt.nz/documents/2016/PW5.xlsx

