Health
Potentially hazardous drinking
Definition
The proportion of the population aged 15 years and over who were potentially hazardous drinkers.
RelevanceTop
Potentially hazardous drinking is an established drinking pattern of alcohol consumption that carries a risk of harming the drinker's physical or mental health, or having harmful social effects on the drinker or others. In addition to its effect on rates of disease, alcohol contributes to death and injury through traffic accidents, drowning, suicide, assaults and domestic violence.
Current level and trendsTop
In 2013/2014, the age-standardised proportion of potentially hazardous drinkers was 18.1 percent as measured by the New Zealand Health Survey. This was similar to 2012/2013 (17.3 percent) and 2011/2012 (16.9 percent), but slightly lower than in 2006/2007 (19.9 percent).
An estimated 575,000 New Zealanders aged 15 years and over were potentially hazardous drinkers in 2013/2014, an increase of 24,000 from 2012/2013.
Age and sex differencesTop
Males were more likely than females to be classified as potentially hazardous drinkers. In 2013/2014, 23.8 percent of males were potentially hazardous drinkers, compared with 12.7 percent of females.
The proportion of males who were potentially hazardous drinkers decreased between 2006/2007 and 2011/2012 before stabilising, while the proportion of females decreased slightly between 2006/2007 and 2011/2012 and increased to 2006/2007 levels in 2013/2014.
Figure H8.1 – Proportion of population aged 15 years and over who were potentially
hazardous drinkers, by sex, 2006/2007–2013/2014
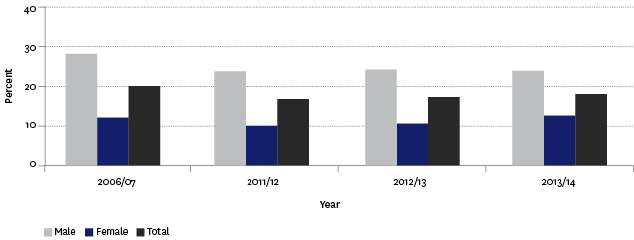
Source: Ministry of Health, New Zealand Health Survey
Note: Data has been age-standardised to the WHO World Standard population.
The proportion of the population who were potentially hazardous drinkers decreased as age increased. In 2013/2014, 26.9 percent of those aged 15–24 years were potentially hazardous drinkers, compared with 23.9 percent of those aged 25–34 years, 15.9 percent of those aged 35–44 years, and 15.7 percent of those aged 45–54 years. In comparison, only 9.7 percent of those aged 55–64 years, 5.9 percent of those aged 65–74 years and 2.0 percent of those aged 75 years and over were defined as potentially hazardous drinkers.
The proportion of potentially hazardous drinkers decreased or remained at the same level between 2006/2007 and 2013/2014 for all age groups, except for those aged 45–54 years who increased by 3.6 percentage points.
Figure H8.2 – Proportion of population aged 15 years and over who were potentially
hazardous drinkers, by age group, 2006/2007–2013/2014
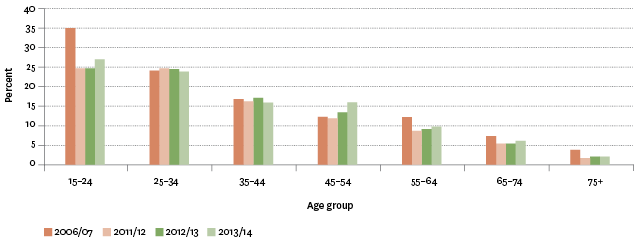
Source: Ministry of Health, New Zealand Health Survey
Note: Data has been age-standardised to the WHO World Standard population.
Ethnic differencesTop
In 2013/2014, Māori had the highest proportion (29.5 percent) of potentially hazardous drinkers compared with all other ethnic groups. In contrast, people in the Asian ethnic group had the lowest (3.3 percent) proportion. The proportions for European/Other (19.7 percent) and Pacific peoples (18.2 percent) were similar to each other.
This pattern was also found in each of the previous surveys.
Table H8.1 – Proportion of population aged 15 years and over who were
potentially hazardous drinkers, by ethnic group and sex, 2006/2007–2013/2014
| European/Other | Māori | Pacific peoples | Asian | |
|---|---|---|---|---|
| 2006/07 | ||||
| Male | 29.3 | 41.0 | 32.3 | 9.0 |
| Female | 12.7 | 22.2 | 12.0 | 1.8 |
| Total | 20.9 | 31.1 | 21.7 | 5.3 |
| 2011/12 | ||||
| Male | 25.4 | 35.4 | 28.4 | 6.5 |
| Female | 10.3 | 20.0 | 9.7 | 1.8 |
| Total | 17.8 | 27.4 | 18.4 | 4.1 |
| 2012/13 | ||||
| Male | 25.9 | 37.1 | 26.7 | 6.5 |
| Female | 11 | 22.3 | 7.9 | 1.6 |
| Total | 18.4 | 29.4 | 16.6 | 4.2 |
| 2013/14 | ||||
| Male | 26.3 | 35.9 | 27.0 | 4.7 |
| Female | 13.5 | 24.0 | 11.5 | 2.0 |
| Total | 19.7 | 29.5 | 18.2 | 3.3 |
Source: Ministry of Health, New Zealand Health Survey
Note: Data has been age-standardised to the WHO World Standard population.
Socio-economic differencesTop
In 2013/2014, people in the most deprived areas (ie NZDep2013 quintile level 5) were more likely than those in the least deprived areas (ie NZDep2013 quintile levels 1 and 2) to be potentially hazardous drinkers (21.6 percent, compared with 15.5 percent and 16.6 percent respectively). The proportions of potentially hazardous drinkers in NZDep2013 quintile levels 3 and 4 were 19.5 percent and 17.1 percent respectively.
Regional differencesTop
In 2013/2014, the geographical areas with the highest proportions of potentially hazardous drinkers were Gisborne/Hawke's Bay (27.5 percent) and Otago/Southland (23.2 percent).
Canterbury (12.3 percent) and Tasman/Nelson/Marlborough/West Coast (14.0 percent) had the lowest proportions of potentially hazardous drinkers.
International comparisonTop
The indicator used by the OECD for international comparisons is an average of the annual consumption of alcohol per person aged 15 years and over.
In 2011, New Zealand's average annual consumption was 9.5 litres per person which was below the median (10.1 litres per person) for the 25 OECD countries with data available. New Zealand's average annual consumption was higher than that of the United States (8.6 litres per person) and Canada (8.0 litres per person), but lower than Australia (10.1 litres per person), the United Kingdom (10.6 litres per person) and Ireland (11.7 litres per person).
Data for this section can be found at: www.socialreport.msd.govt.nz/documents/2016/h8.xlsx
