Social wellbeing of selected demographic groups
Changes in social wellbeing for Pacific peoples
Figure DS1.2 – Changes in social wellbeing for Pacific peoples, selected indicators,
2005–2008 to 2012–2014
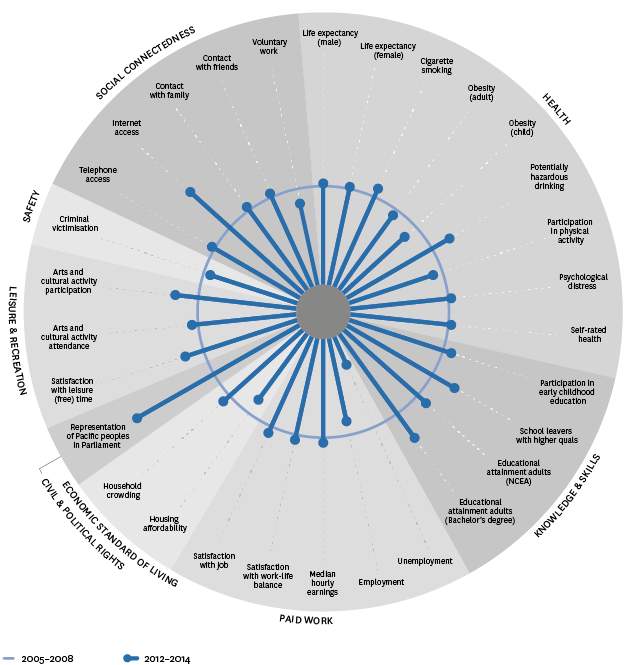
Interpreting “Changes in social wellbeing for Pacific peoples, selected indicators, 2005–2008 to 2012–2014”
Note: In some cases, the data is averaged over the three years in each period. Only indicators where comparisons can be made for Pacific peoples over the time periods used have been included. Limitations: This style of presentation means that direct comparisons in the size of changes for different indicators cannot be made. Users should refer to the indicator section for more information. While a radial chart may indicate a change or difference in outcomes, the change may not be statistically significant. This will often be true for indicators that fall on, or close to, the central circle. |
|---|
 represents mean outcomes for Pacific peoples for each indicator between 2005 and 2008.
 represent mean outcomes for Pacific peoples between 2012 and 2014.