Knowledge and skills
Educational attainment of the adult population
Definition
The proportion of adults aged 25–64 years with an educational attainment of at least upper secondary school level.
The proportion of adults aged 25–64 years with an educational attainment of Bachelor’s degree or higher.
RelevanceTop
The educational attainment of the adult population is an indicator of the skills available in the economy. The level of formal educational qualifications in the population is a commonly used proxy for the stock of “human capital”, ie the skills available in the population and labour force. At least upper secondary school level includes any formal qualification at NCEA Level 2 (or equivalent) or higher. Bachelor’s degree or higher includes Bachelor’s degrees, Postgraduate Certificates or Diplomas, Master’s degrees, and Doctorates.
Current level and trendsTop
In the year ended December 2014, 74.3 percent of those aged 25–64 years (or 1,685,200 people) had a qualification of at least NCEA Level 2 (L2). The proportion with at least NCEA L2 has generally been increasing over the last 10 years.
The proportion of those aged 25–64 years who had a qualification of Bachelor's degree or higher was 29.8 percent (or 675,800 people), an increase from 29.0 percent (or 650,500 people) in the year ended December 2013. The proportion with Bachelor's degree or higher has generally been increasing over the last 10 years.
Those with a Bachelor's degree or higher reached a peak of 29.8 percent in 2014 (675,800 people). The lowest proportion of those with a Bachelor's degree or higher recorded was 6.3 percent in 1986.
Figure K4.1 – Proportion of adults aged 25–64 years with an educational qualification
of at least NCEA Level 2 and Bachelor's degree or higher, 1986–2014
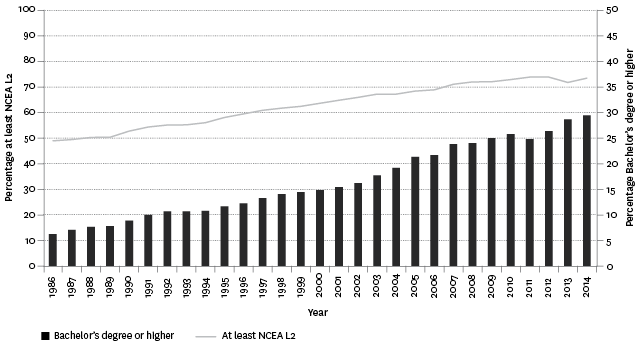
Source: Statistics New Zealand, Household Labour Force Survey
Notes: Year ended December. Qualifications and coding have changed over the years presented. The time series provided is a best fit.
Age and sex differencesTop
In the year ended December 2014, the proportion of males aged 25–64 years with a qualification of at least NCEA L2 was 75.5 percent. This compares with 73.3 percent for females. The proportion of females with a qualification of Bachelor's degree or higher was 32.2 percent, compared with 27.2 percent for males.
Sex differences in educational attainment have narrowed over time, with females catching up to males for qualifications of at least NCEA L2. In 1986, the gap between males and females was 14.6 percentage points in favour of males, compared with 2.2 percent in 2014. Females have overtaken males for qualifications at Bachelor's degree or higher. In 1986, the gap favoured males at 4.2 percentage points, compared with a 5.0 percentage point gap in 2014 favouring females.
Figure K4.2 – Proportion of adults aged 25–64 years with an educational qualification
of at least NCEA Level 2 and Bachelor's degree or higher, by sex, 1986–2014
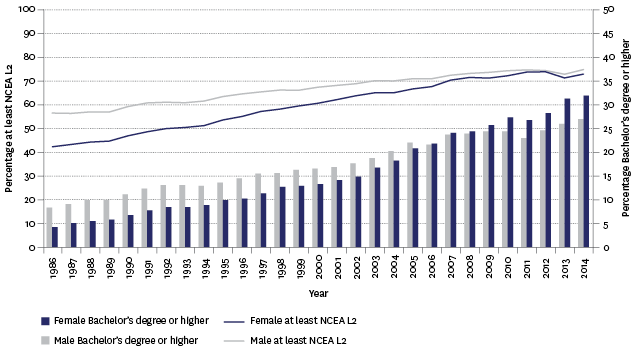
Source: Statistics New Zealand, Household Labour Force Survey
Notes: Year ended December. Qualifications and coding have changed over the years presented. The time series provided is a best fit.
Younger adults are much more likely to have qualifications of at least NCEA L2 or Bachelor's degree or higher, reflecting ongoing educational improvements for younger cohorts. In the year ended December 2014, 81.4 percent of 25–34 year olds had at least NCEA L2, compared with 65.5 percent of 55–64 year olds. The proportion of those aged 25–34 years with a Bachelor's degree or higher was 35.9 percent, compared with 21.5 percent for 55–64 year olds.
Table K4.1 – Proportion of adults with an educational qualification of at least
NCEA Level 2 and Bachelor's degree or higher, by age group and sex, selected
years 1986–2014
| Year | 25–34 | 35–44 | 45–54 | 55–64 | Males 25–64 | Females 25–64 | Total 25–64 | Difference male and female |
|---|---|---|---|---|---|---|---|---|
| At least NCEA L2 | ||||||||
| 1986 | 53.4 | 49.7 | 46.4 | 46.2 | 57.0 | 42.4 | 49.6 | 14.6 |
| 1991 | 59.9 | 58.3 | 51.5 | 43.9 | 61.3 | 48.8 | 55.0 | 12.5 |
| 1996 | 65.0 | 64.0 | 56.9 | 48.7 | 65.2 | 55.3 | 60.2 | 9.9 |
| 2001 | 70.6 | 69.1 | 65.1 | 52.4 | 68.8 | 62.5 | 65.6 | 6.3 |
| 2006 | 77.8 | 72.6 | 69.0 | 56.4 | 71.6 | 68.0 | 69.7 | 3.6 |
| 2011 | 80.7 | 78.5 | 74.0 | 64.6 | 75.4 | 74.2 | 74.7 | 1.2 |
| 2014 | 81.4 | 78.2 | 71.7 | 65.5 | 75.5 | 73.3 | 74.3 | 2.2 |
| Bachelor's degree or higher | ||||||||
| 1986 | 7.5 | 7.1 | 5.3 | 4.0 | 8.4 | 4.2 | 6.3 | 4.2 |
| 1991 | 11.3 | 12.1 | 9.0 | 5.6 | 12.4 | 7.8 | 10.1 | 4.6 |
| 1996 | 14.5 | 13.7 | 11.5 | 7.3 | 14.6 | 10.3 | 12.4 | 4.3 |
| 2001 | 17.8 | 16.7 | 16.5 | 8.8 | 17.0 | 14.2 | 15.6 | 2.8 |
| 2006 | 28.1 | 23.6 | 19.9 | 14.1 | 21.8 | 22.0 | 21.9 | -0.2 |
| 2011 | 32.3 | 27.6 | 22.2 | 18.0 | 23.2 | 27.0 | 25.1 | -3.8 |
| 2014 | 35.9 | 35.0 | 26.3 | 21.5 | 27.2 | 32.2 | 29.8 | -5.0 |
Source: Statistics New Zealand, Household Labour Force Survey
Notes: Year ended December. Qualifications and coding have changed over the years presented. The time series provided is a best fit.
Ethnic differencesTop
While there have been improvements for all ethnic groups, marked differences in adult educational attainment remain. In the year ended December 2014, the Asian ethnic group had the highest proportion with a qualification of at least NCEA L2 (86.6 percent), followed by the European/Other ethnic group (75.4 percent), Māori (57.1 percent) and Pacific peoples (56.9 percent). Ethnic differences were even more marked for Bachelor's degree or higher. The Asian ethnic group again had the highest proportion (48.8 percent), followed by the European/Other ethnic group (29.0 percent), Māori (15.3 percent) and Pacific peoples (12.7 percent).
Figure K4.3 – Proportion of adults with an educational qualification of at least NCEA
Level 2 and Bachelor's degree or higher, by ethnic group, selected years 1986–2014
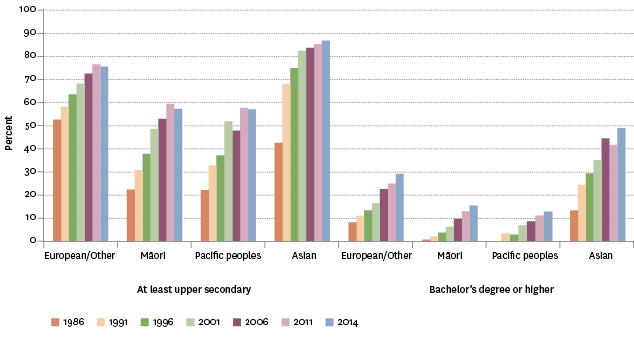
Source: Statistics New Zealand, Household Labour Force Survey
Notes: Year ended December. For 2007 and earlier people are counted in only one ethnic group (ethnicities are prioritised). From 2008, people can be counted in more than one ethnic group (total response). Caution should be used when comparing the two ethnic series over time.
Regional differencesTop
Wellington had the highest proportion with a qualification of at least NCEA L2 (79.7 percent for the year ended December 2014). Southland had the lowest proportion at 64.0 percent. Wellington also had the highest proportion with a qualification of Bachelor's degree or higher (38.1 percent). Northland had the lowest proportion at 17.3 percent.
International comparisonTop
Data for this section can be found at: www.socialreport.msd.govt.nz/documents/2016/k4.xlsx
