Intentional injury child mortality
Definition
The number of children under 15 years of age who have died as a result of an intentional injury, per 100,000 children under 15 years.
Relevance
Children and young people have a need for, and an entitlement to, safety and security in which to grow and develop. Abuse or violence is the ultimate failure to provide this. This indicator measures violence against children leading to death.
Current level and trends
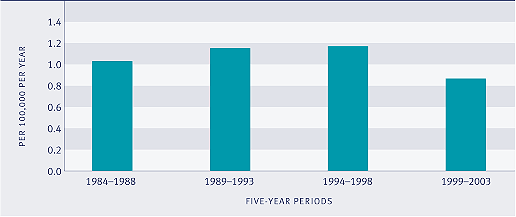
In the five years to 2003, 38 children under 15 years of age died as a result of maltreatment, a decline from 50 in the previous five-year period. The five-year average annual rate increased slightly over the period 1984–1988 to 1994–1998 (from 1.0 to 1.2 per 100,000), and declined to 0.9 per 100,000 in 1999–2003. However, it should be noted that trends are difficult to discern, as rates based on very small numbers are volatile, even when averaged over five years.
Figure SS1.1 Five-year average annual maltreatment mortality rates for children under 15 years, 1984–1988 to 1999–2003

Sources: Ministry of Health, New Zealand Health Information Service (ICD–9 codes E960–E969, ICD–10 codes X85–Y09); Statistics New Zealand, mean resident population estimates for years ended December
Notes: (1) Causes of death include fight, brawl, rape, corrosive or caustic substances, poisoning, hanging and strangulation, submersion (drowning), firearms and explosives, cutting and piercing instruments, child maltreatment and other assault
(2) Rates are based on small numbers and should be interpreted with caution
Age and sex differences
Rates of death from maltreatment are higher for children under 5 years of age than for older children. In the five years to 2003, the rate for children under five years was 1.7 deaths per 100,000, more than three times higher than the rate for 5–14 year olds (0.5 per 100,000).
There is little difference between the sexes in overall maltreatment death rates.
Table SS1.1 Five-year average annual maltreatment mortality rates for children under 15 years, by age and sex, 1994–1998 and 1999–2003
| Five-year period |
0–4 years |
5–9 years |
10–14 years |
| |
Males |
Females |
Total |
Males |
Females |
Total |
Males |
Females |
Total |
| 1994–1998 |
1.7 |
2.5 |
2.1 |
0.7 |
0.7 |
0.7 |
1.3 |
0.0 |
0.7 |
| 1999–2003 |
2.2 |
1.2 |
1.7 |
0.1 |
1.0 |
0.5 |
0.3 |
0.5 |
0.4 |
Source: Ministry of Health, New Zealand Health Information Service
Ethnic differences
In the five years from 1999 to 2003, Māori children died from maltreatment at an average annual rate of 1.5 per 100,000 children. Over the same period, non-Māori children died at an average annual rate of 0.7 per 100,000 children.
International comparison
A UNICEF study of child maltreatment deaths in rich nations in the 1990s reported that New Zealand had the third highest child maltreatment death rate (1.2 per 100,000), behind only the United States and Mexico (both 2.2 per 100,000). This finding should be treated with caution because, in a small country like New Zealand, the very small numbers involved produce highly volatile rates. In addition, although the figures come from the same data source (the World Health Organisation) and use the same international classification of death by cause, there may be differences between countries, and within countries over time, in the classification of death by intention.
|

