Loneliness
Definition
The proportion of people aged 15 years and over who reported feeling lonely "sometimes", "most of the time" or "always" during the previous 12 months, in the Quality of Life in New Zealand's Largest Cities Survey 2004.
Relevance
Social contact is fundamentally important to people: humans are social creatures. Self-assessed loneliness is a proxy indicator of whether people are happy with the amount and quality of social contact they have. As well as being an undesirable state in itself, loneliness may also contribute to poor outcomes in other areas, including adverse health problems such as stress, anxiety or depression.
Current level
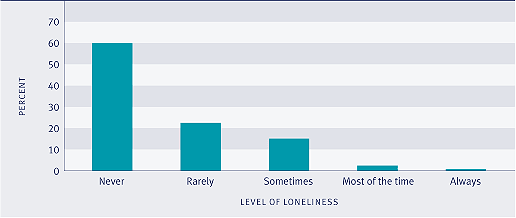
In 2004, 18 percent of New Zealanders reported feeling lonely during the last 12 months: 15 percent said they felt lonely "sometimes", 2 percent said they were lonely "most of the time" and fewer than 1 percent said they "always" felt lonely. Unemployed people and people without a partner were more likely than other New Zealanders to report feeling lonely (31 percent and 32 percent, respectively).
Figure SC4.1 Proportion of people experiencing loneliness, 2004

Source: Auckland City Council et al (2005) Quality of Life in New Zealand's Largest Cities Survey 2004
Age differences
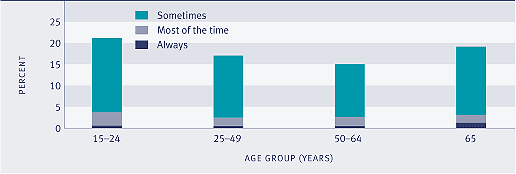
Loneliness is most prevalent among people aged 15–24 years, followed by those aged 65 years and over. Twenty-one percent of 15–24 year olds and 19 percent of those aged 65 years and over experienced feelings of loneliness "sometimes", "most of the time", or "always". Levels of loneliness were lower among those aged 25–49 years (17 percent) and lowest among 50–64 year olds (15 percent).
Figure SC4.2 Proportion of people experiencing loneliness, by age, 2004

Source: Auckland City Council et al (2005) Quality of Life in New Zealand's Largest Cities Survey 2004
Sex differences
Females (20 percent) were more likely to have reported feeling lonely "sometimes", "most of the time" or "all of the time" during the last 12 months than males (15 percent). Seventeen percent of females said they were lonely "sometimes" compared to 13 percent of males.
Ethnic differences
Europeans reported the lowest rate of loneliness with 15 percent reporting they were lonely "sometimes", "most of the time" or "always". Twenty-two percent of Māori and 25 percent of Pacific peoples reported they were "sometimes", "most of the time" or "always" lonely. Asian peoples and people in Other ethnic groups (excluding Asians) reported the highest rates of loneliness (both 36 percent).
Socio-economic differences
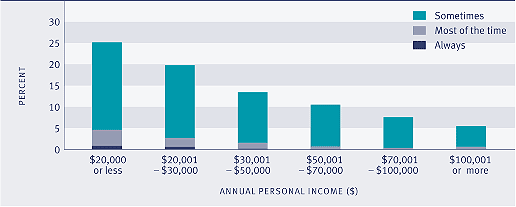
Experiencing loneliness declines as personal income rises. People with personal incomes of $20,000 or less reported higher rates of loneliness than people with larger incomes: 25 percent said they felt lonely "sometimes", "most of the time" or "always" in the past 12 months. This compares with a loneliness rate of only 5 percent for those with a personal income over $100,000.
Figure SC4.3 Proportion of people experiencing loneliness, by personal income, 2004

Source: Auckland City Council et al (2005) Quality of Life in New Zealand's Largest Cities Survey 2004
Regional differences
People living in Manukau City had the highest reported incidence of loneliness with 21 percent reporting they felt lonely "always", "most of the time" or "sometimes". Those living in the Rodney District had the lowest reported incidence of loneliness (14 percent).
|


