School leavers with higher qualifications
Definition
The proportion of secondary school leavers who left school with a
qualification at National Certificate of Educational Achievement (NCEA)
Level 2 or above.
Relevance
Upper secondary school qualifications serve as the foundation
for higher (post-secondary) learning and training opportunities as well
as the preparation for direct entry into the labour market. Those who
leave school early with few qualifications are at a much greater risk
of unemployment or vulnerability in the labour force and of having low
incomes.42
Current level and trends
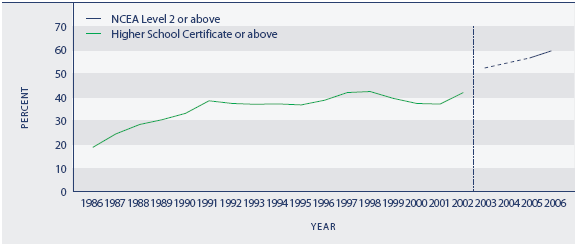
In 2006, 60 percent of school leavers (34,000 students) left
school with a qualification at NCEA Level 2 or above, an increase from
the 2005 figure of 57 percent (33,000 students).43 Because
of changes in the qualification structure, it is not possible to
compare exactly the attainment of upper secondary school students who
left school before 2003 with those who left school later. To illustrate
trends in higher school attainment over the long term, Figure K2.1
includes Higher School Certificate and above for the years 1986 to 2002.
Figure K2.1 Proportion of school leavers
with Higher School Certificate or above, 1986–2002, and NCEA Level 2 or
above, 2003, 2005–2006

Source: Ministry of Education
Notes: (1) A direct comparison cannot be made between rates up to and
including 2002 with rates for 2003 on, due to the change in the
qualification structure (see Appendix 2 for details) (2) Because of
methodological changes, 2004 is not comparable with other years and has
been omitted
Sex differences
Female students are more likely than male students to leave
school with an upper secondary school qualification. Between 2005 and
2006, the proportion of school leavers with NCEA Level 2 or above
increased for both sexes but there was a slightly larger increase for
males than for females. As a result, the sex difference in school
attainment narrowed slightly between 2005 and 2006, from 10 percentage
points to 9 percentage points.
Table K2.1 Proportion (%) of school
leavers with NCEA Level 2 or above, by sex, 2003, 2005–2006
| |
Males |
Females |
| 2003 |
47.6 |
57.9 |
| 2005 |
52.0 |
62.3 |
| 2006 |
55.8 |
64.5 |
Source: Ministry of Education
Note: Because of methodological changes, 2004 is not comparable with
other years and has been omitted
Ethnic differences
The proportion of school leavers with upper secondary school
qualifications varies widely by ethnic group. Asian students who left
school in 2006 had the highest proportion with NCEA Level 2 or above,
followed by European school leavers, then Pacific and Māori school
leavers.
Between 2005 and 2006, there was an increase for all ethnic
groups in the proportion of students leaving with a qualification at
NCEA Level 2 or above. The increase was greater for Māori and Pacific
students than for European and Asian students.
Table K2.2 Proportion (%) of school
leavers with NCEA Level 2 or above, by ethnic group, 2003, 2005–2006
| |
European |
Māori |
Pacific peoples
|
Asian |
Other |
Total |
| 2003 |
57.4 |
28.8 |
42.3 |
75.1 |
54.2 |
52.6 |
| 2005 |
63.0 |
32.7 |
45.3 |
79.9 |
55.8 |
57.1 |
| 2006 |
65.4 |
36.7 |
49.6 |
82.2 |
63.5 |
60.2 |
Source: Ministry of Education
Note: Because of methodological changes, 2004 is not comparable with
other years and has been omitted
Socio-economic differences
Young people from schools that draw their students from low
socio-economic communities are less likely than other young people to
attain higher school qualifications. In 2006, only 43 percent of school
leavers from deciles 1–3 schools (in the most disadvantaged
communities) attained qualifications at NCEA Level 2 or above, compared
with 57 percent of those leaving deciles 4–7 schools and 74 percent of
those leaving deciles 8–10 schools.
Regional differences
The Nelson region had the highest proportion (70 percent) of
2006 school leavers with qualifications at NCEA Level 2 or above,
followed by Otago (67 percent), Auckland (66 percent), Wellington and
Canterbury (each 63 percent). The West Coast had the lowest proportion
(35 percent), followed by Gisborne (48 percent) and Tasman (51
percent).
|

