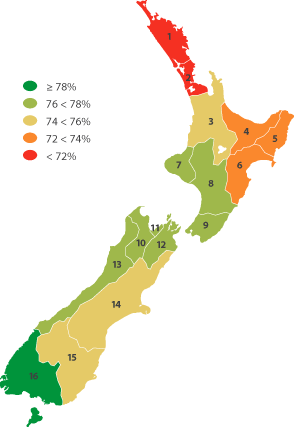
Employment
Definition: The employment rate is the proportion of the population aged 15–64 years employed for at least one hour per week, as measured by the Household Labour Force Survey.

Employment rate (the percentage of the population aged 15–64 years who are employed)
| Region |
1986 |
1991 |
1996 |
2001 |
2002 |
2003 |
2004 |
2005 |
2006 |
2007 |
2008 |
2009 |
| 1 |
Northland |
65.8 |
60.5 |
63.1 |
64.9 |
64.7 |
66.8 |
68.3 |
70.9 |
73.2 |
74.3 |
70.5 |
67.7 |
| 2 |
Auckland |
74.5 |
65.6 |
72.4 |
69.9 |
69.9 |
70.0 |
70.9 |
71.1 |
71.9 |
71.8 |
71.8 |
69.5 |
| 3 |
Waikato |
69.7 |
65.7 |
69.2 |
70.9 |
74.3 |
74.7 |
75.8 |
75.8 |
75.7 |
77.1 |
76.6 |
74.0 |
| 4 |
Bay of Plenty |
69.8 |
62.5 |
66.2 |
67.8 |
70.3 |
70.5 |
75.3 |
75.4 |
76.1 |
76.9 |
74.5 |
72.2 |
| 5 |
Gisborne |
70.4 |
59.9 |
67.5 |
69.5 |
71.9 |
71.9 |
71.3 |
73.5 |
75.0 |
76.0 |
74.4 |
72.0 |
| 6 |
Hawke’s Bay |
| 7 |
Taranaki |
70.7 |
63.1 |
67.7 |
72.4 |
75.7 |
75.8 |
73.5 |
76.0 |
77.1 |
77.6 |
76.6 |
76.9 |
| 8 |
Manawatu-Whanganui |
70.7 |
62.1 |
66.5 |
68.5 |
70.2 |
70.2 |
70.4 |
73.0 |
73.3 |
71.7 |
73.2 |
73.1 |
| 9 |
Wellington |
76.0 |
68.9 |
72.8 |
75.1 |
74.2 |
73.4 |
73.0 |
74.4 |
75.2 |
77.3 |
76.7 |
76.3 |
| 10 |
Tasman |
70.5 |
68.7 |
72.5 |
75.6 |
76.3 |
75.9 |
76.5 |
77.9 |
77.9 |
77.9 |
77.3 |
76.5 |
| 11 |
Nelson |
| 12 |
Marlborough |
| 13 |
West Coast |
| 14 |
Canterbury |
72.0 |
66.2 |
72.6 |
74.8 |
75.5 |
75.9 |
77.6 |
79.0 |
78.7 |
78.0 |
77.3 |
74.8 |
| 15 |
Otago |
70.2 |
64.9 |
69.6 |
71.7 |
71.8 |
70.9 |
72.6 |
74.5 |
75.6 |
75.9 |
75.8 |
74.4 |
| 16 |
Southland |
69.5 |
67.9 |
71.9 |
75.9 |
74.6 |
75.5 |
77.6 |
79.6 |
79.8 |
81.4 |
80.8 |
80.4 |
| New Zealand |
72.2 |
65.3 |
70.6 |
71.4 |
72.2 |
72.2 |
73.2 |
74.3 |
74.9 |
75.2 |
74.7 |
72.9 |
Source: Statistics New Zealand, Household Labour Force Survey, average for December years. |