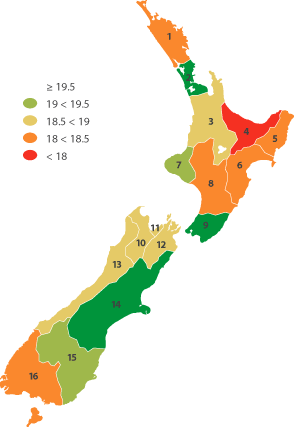
Median hourly earnings
Definition: Median hourly earnings from all wages and salaries for employees aged 15 years and over earning income from wage and salary jobs, as measured by the New Zealand Income Survey, adjusted for inflation.

Median hourly earnings ($) from all wage and salary jobs for employees aged 15 years and over working in wage and salary jobs, in June 2009 dollars
| Region |
1998 |
1999 |
2000 |
2001 |
2002 |
2003 |
2004 |
2005 |
2006 |
2007 |
2008 |
2009 |
| 1 |
Northland |
14.65 |
15.48 |
15.56 |
16.10 |
15.80 |
15.52 |
16.62 |
16.64 |
16.04 |
16.81 |
16.80 |
18.17 |
| 2 |
Auckland |
18.01 |
18.45 |
18.67 |
18.12 |
18.38 |
18.67 |
18.89 |
19.36 |
19.16 |
20.12 |
19.91 |
20.62 |
| 3 |
Waikato |
16.16 |
15.90 |
15.92 |
16.31 |
16.60 |
16.41 |
17.40 |
17.72 |
17.42 |
17.89 |
17.84 |
18.89 |
| 4 |
Bay of Plenty |
15.88 |
15.90 |
15.57 |
15.71 |
15.80 |
16.34 |
16.48 |
17.01 |
17.10 |
17.30 |
17.60 |
17.90 |
| 5 |
Gisborne |
15.84 |
15.55 |
15.81 |
15.83 |
16.01 |
16.34 |
16.48 |
16.64 |
16.63 |
16.79 |
17.19 |
18.14 |
| 6 |
Hawke’s Bay |
| 7 |
Taranaki |
16.48 |
15.65 |
15.50 |
15.71 |
15.46 |
16.65 |
16.96 |
17.28 |
17.08 |
17.60 |
18.10 |
19.18 |
| 8 |
Manawatu-Whanganui |
14.77 |
15.11 |
15.35 |
15.71 |
15.41 |
15.71 |
16.53 |
17.33 |
16.04 |
16.79 |
17.10 |
18.00 |
| 9 |
Wellington |
18.53 |
19.51 |
18.67 |
18.73 |
19.32 |
18.96 |
19.48 |
18.08 |
20.04 |
20.98 |
20.25 |
20.50 |
| 10 |
Tasman |
15.21 |
15.27 |
15.56 |
15.46 |
15.41 |
15.73 |
16.38 |
16.64 |
17.07 |
17.74 |
18.10 |
18.50 |
| 11 |
Nelson |
| 12 |
Marlborough |
| 13 |
West Coast |
| 14 |
Canterbury |
15.84 |
16.54 |
16.55 |
16.22 |
16.43 |
16.54 |
17.19 |
18.08 |
17.82 |
18.36 |
18.33 |
19.60 |
| 15 |
Otago |
16.30 |
15.27 |
14.94 |
15.71 |
15.41 |
16.11 |
16.04 |
17.47 |
17.64 |
18.04 |
17.90 |
19.18 |
| 16 |
Southland |
17.02 |
15.27 |
16.59 |
16.04 |
16.60 |
15.67 |
16.51 |
16.64 |
17.99 |
17.44 |
17.74 |
18.00 |
| New Zealand |
16.78 |
16.96 |
16.84 |
16.91 |
17.19 |
17.46 |
17.58 |
17.85 |
18.17 |
18.88 |
18.81 |
19.47 |
Statistics New Zealand, New Zealand Income Survey, and Ministry of Social Development |