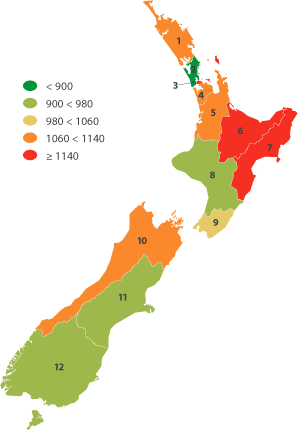
Download for Regional council areas:
|
Recorded criminal offences
Definition: The recorded criminal offence rate per 10,000 population.

Recorded criminal offences per 10,000 population
| Police district |
1999 |
2000 |
2001 |
2002 |
2003 |
2004 |
2005 |
2006 |
2007 |
2008 |
2009 |
| 1 |
Northland |
1,161 |
1,159 |
1,140 |
1,196 |
1,106 |
1,021 |
1,035 |
1,005 |
1,046 |
1,040 |
1,116 |
| 2 |
Waitemata |
859 |
861 |
834 |
858 |
860 |
778 |
763 |
793 |
752 |
760 |
769 |
| 3 |
Auckland |
1,445 |
1,473 |
1,552 |
1,557 |
1,536 |
1,337 |
1,325 |
1,327 |
1,381 |
1,312 |
1,333 |
| 4 |
Counties/Manukau |
1,143 |
1,137 |
1,116 |
1,169 |
1,099 |
949 |
1,037 |
1,120 |
1,063 |
1,045 |
1,118 |
| 5 |
Waikato |
1,245 |
1,112 |
1,081 |
1,090 |
1,010 |
931 |
993 |
1,073 |
1,027 |
979 |
1,068 |
| 6 |
Bay Of Plenty |
1,318 |
1,269 |
1,323 |
1,303 |
1,286 |
1,204 |
1,131 |
1,059 |
1,105 |
1,060 |
1,190 |
| 7 |
Eastern |
1,245 |
1,274 |
1,246 |
1,309 |
1,250 |
1,148 |
1,166 |
1,241 |
1,226 |
1,210 |
1,275 |
| 8 |
Central |
1,195 |
1,107 |
1,047 |
1,020 |
1,002 |
874 |
893 |
957 |
951 |
963 |
932 |
| 9 |
Wellington |
1,009 |
994 |
1,002 |
997 |
1,045 |
952 |
907 |
945 |
947 |
1,025 |
1,021 |
| 10 |
Tasman |
1,020 |
1,026 |
990 |
1,030 |
1,026 |
1,001 |
941 |
945 |
960 |
1,017 |
1,086 |
| 11 |
Canterbury |
1,074 |
1,003 |
995 |
985 |
996 |
937 |
855 |
880 |
884 |
938 |
957 |
| 12 |
Southern |
1,140 |
1,059 |
1,013 |
1,074 |
1,102 |
984 |
993 |
980 |
971 |
963 |
952 |
| New Zealand |
1,142 |
1,108 |
1,099 |
1,115 |
1,099 |
994 |
986 |
1,014 |
1,008 |
1,011 |
1,046 |
Source: Statistics New Zealand |