Relevance
Voter turnout rates are a measure of political participation. They can be seen as an indicator of the extent to which citizens are a part of the political process, and an indicator of the level of trust in political institutions.
Current Level And Trends
1. General elections
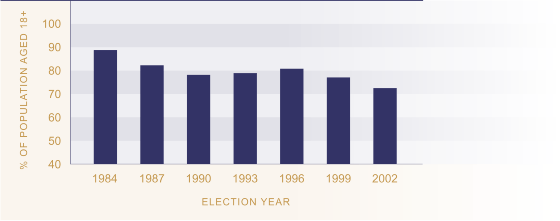
Voter turnout of the eligible population was 72.5 percent in 2002. Voter participation in general elections declined sharply from 89 percent in 1984 to 78 percent in 1990, increased slightly to 81 percent in 1996, then declined again to a new low in 2002.
Figure CP1.1 Proportion of voting age
population who cast votes, 1984-2002

Source: Electoral Commission
(2002), p 174. 1984 figure calculated by Ministry of Social Development
Comparisons Between Groups
Because of the nature of the secret ballot, information on differences in participation rates among various sectors of the New Zealand population is not directly available. Nevertheless, results from several New Zealand Election Surveys over a number of years associate a number of social, demographic, and occupational characteristics with impacts on the voter turnout rate. Non-voters are more likely to be people on lower incomes, younger people, and members of Māori or Pacific ethnic groups. There are few differences in voting turnout rates between men and women.63
Regional Differences
There are few discernible differences in voting turnout rates between rural and urban voters, although non-voting tends to be lowest in provincial cities.
International Comparison
New Zealand's voter turnout rate in 2002 was 72.5 percent, compared to an OECD median over 1997 to 2002 of 71 percent.64 This placed New Zealand 15th out of 30 OECD countries. Greece had the best voter turnout at 89 percent. Voter turnout was higher in Australia (sixth, 82 percent) than New Zealand, but lower in Canada (26th, 55 percent), the United Kingdom (23rd, 58 percent) and the United States (29th, 47 percent).
Current Level And Trends
2. Local authority elections
There are 252 elected local authorities in New Zealand : 12 regional councils, 21 district health boards (established 1 January 2001), 15 city councils, 59 district councils and 146 community boards. There was a major restructuring of local government in 1989. Voter turnout in the 2001 local authority elections was the lowest since 1989 for all except regional councils, which had the second lowest since then.
Table CP1.1 Voter turnout (%) in local authority elections, 1989-2001
| 1989 | 1992 | 1995 | 1998 | 2001 | |
|---|---|---|---|---|---|
| Regional councils | 56 | 52 | 48 | 53 | 49 |
| District health boards | 50 | ||||
| Territorial authorities | |||||
| City councils | 52 | 48 | 49 | 51 | 45 |
| City mayors | 50 | 48 | 49 | 51 | 45 |
| District councils | 67 | 61 | 59 | 61 | 57 |
| District mayors | 67 | 61 | 59 | 59 | 56 |
| Community boards | 54 | 49 | 50 | 50 | 46 |
Source: Department of Internal
Affairs (2003), Table 7.1
Note: There was no election held for Rodney District in 2001
Local authority voter turnout is generally highest for district councils, with their more rural population base, for smaller city councils and those in the South Island. Councils of these types all had a majority turnout in 2001, while among large city councils and North Island city councils, fewer than half of eligible electors voted. Voter turnout ranged from 65 percent for district councils in the South Island, to 43 percent for city councils in the North Island.
In large regional councils, there was an upward trend in voter turnout between 1995 and 2001. However, the average turnout was still higher among small regional councils. Similarly, voter turnout was highest on average among the smaller district health boards.
