Relevance
Suicide is an indicator of mental health in the population and a major cause of death among younger adults.
Current Level and Trends
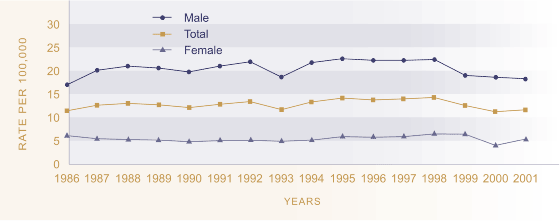
In 2001, 499 people died by suicide, an increase from 458 in 2000, but fewer than the 516 recorded in 1999. The age-standardised16 suicide death rate was 11.7 per 100,000 in 2001, compared with 11.2 in 2000 and 12.6 in 1999. Over the 1980s and 1990s there was an upward trend in the suicide death rate, which reached a peak of 14.3 per 100,000 in 1998. Since then the trend has generally been downward and the 2001 rate was similar to the 1986 rate of 11.5 per 100,000.
Figure H4.1 Age-standardised suicide death
rate by gender, 1986-2001

Source: Ministry of Health; New
Zealand Health Information Service
Note: 2000 and 2001 figures are provisional. Age-standardised to Segi's
world population
Sex Differences
Males have a much higher rate of death by suicide than females, with 18.3 deaths per 100,000 males in 2001, compared with 5.5 deaths per 100,000 females. The difference is associated with choice of methods.17 The male suicide rate increased sharply in the late 1980s and declined after 1998, but was still higher in 2001 than it was in 1986. In comparison, the female rate has been relatively stable. It increased slightly during 1996-1999, fell in 2000 and rose in 2001 but not to the level it had been in 1999. Because of the small numbers involved, it is more reliable to consider the trend over several years.
While males account for most suicide deaths (77 percent in 2001), females account for the majority of recorded suicide attempts that do not result in death (66 percent in 2001/2002).
Age Differences
In 2001, the 25-34-year age group had the worst rate of suicide death (21.4 per 100,000, or 118 deaths), followed by the 15-24-year age group (20.0 per 100,000, with 107 deaths). For many decades, the rate of suicide was consistently worst at ages 65 and over but this changed in the late 1980s during a steep increase in youth suicide. The youth suicide rate peaked in 1995, when there were 156 deaths (a rate of 28.7 per 100,000) and has fallen since 1998, though not to the levels recorded in the early 1980s. The pattern is similar for 25-34-year-olds. Suicide rates have been falling among people over 45 years and in 2001, the rate for age group 45-64 was the lowest (10.5 per 100,000). These age patterns may reflect, in part, cohort effects.
Figure H4.2 Suicide death rates by age
group, 1984-1986 to 1999-2001

Source: Ministry of Health; New
Zealand Health Information Service
Note:1. Three-year average rates for 10-year age groups calculated by
Ministry of Social Development
Note:2. 2000 and 2001 figures are provisional
Ethnic Differences
In 2001, there were 79 Māori deaths from suicide, accounting for 16 percent of all suicides in that year. The age-standardised rate of suicide death was 13.4 per 100,000 for Māori, compared to 11.2 for non-Māori. The suicide rate for Māori youth in 2001 was 28.0 per 100,000, compared with the non-Māori rate of 18.1 per 100,000. Suicide deaths for both Māori and non-Māori were lower in 1999-2001 than in 1996-1998. Because of small numbers, trends in Māori suicide rates should be treated with caution.
Table H4.1 Age-standardised suicide rates and number of suicide deaths, Māori and non-Māori, 1996-2001
| Year | Age-standardised rate per 100,000 | Number | ||
|---|---|---|---|---|
| Māori | Non-Māori | Māori | Non-Māori | |
| 1996 | 17.5 | 12.9 | 95 | 445 |
| 1997 | 17.5 | 13.1 | 103 | 458 |
| 1998 | 19.2 | 13.1 | 112 | 465 |
| 1999 | 12.1 | 12.2 | 78 | 438 |
| 2000 | 13.1 | 10.7 | 80 | 378 |
| 2001 | 13.4 | 11.2 | 79 | 420 |
Source: Ministry of Health;
New Zealand Health Information Service
Note: 2000 and 2001 figures are provisional. Age-standardised to
Segi's world population
International Comparison
A comparison of age-standardised suicide rates in 12 OECD countries for the years 1998-2001 shows that New Zealand's rate for males was fifth worst at 18.4 per 100,000, while the female rate of 5.4 was the sixth worst.18 Finland had the worst male suicide rate (28.8 per 100,000 in 1999), while Japan had the worst female rate (9.3 per 100,000 in 2000). Australia (18.5) and Canada (17.9) had slightly worse rates of male suicide than New Zealand. The United Kingdom (9.9) and the United States (15.0) fared considerably better. In regards to females, Australia (4.5), Canada (4.6), the United Kingdom (2.6) and the United States (3.5) all reported better results than New Zealand.
Comparing youth suicide rates in the same 12 OECD countries, New Zealand had the worst male youth suicide rates, equal with Finland, and the second worst female youth suicide rates (after Norway). New Zealand is one of a small number of countries which have higher suicide rates at the younger ages.19
