Relevance
The increasing complexity of our society and the need for a more flexible and highly educated workforce mean that individuals need to be able to understand and apply information of varying difficulty from a range of sources to function effectively at work and in everyday life. The IALS was designed to measure adult literacy skills in English by assessing proficiency levels, using test materials derived from specific contexts within countries.
Current Level
Results from the first international literacy survey in 1996 show that 54 percent of New Zealand's population aged 16-65 had prose literacy skills at Level 3 or above, 50 percent had document skills at Level 3 or above, and 51 percent had quantitative skills at Level 3 or above.
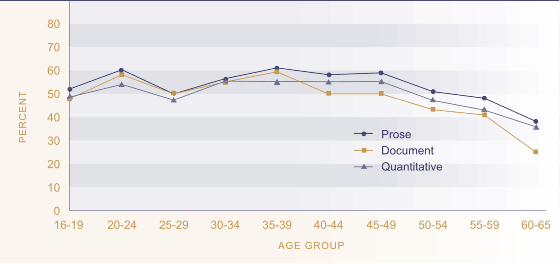
Figure K4.1 Proportion of adults aged
16-65 years with higher literacy skills, by age group, 1996
 Source: OECD
(2000c)
Age Differences
Across all three domains the proportion of people with literacy skills above or at Level 3 and above was broadly similar for people aged 16-49 but then declined with age for people aged over 50. Poorer literacy levels among those aged over 50 may be due either to differences in the education received by older people or to a decline in these skills as people age.
Sex Differences
Women performed better than men in prose literacy (58 percent at Level 3 or above compared with 50 percent for men). The reverse was true in respect of quantitative skills: 55 percent of men had quantitative literacy skills at Level 3 or above, compared with 47 percent of women. Differences between men and women in respect of document literacy skills at those levels were negligible.
Ethnic Differences
Across all three domains, over half of all Europeans had literacy skills at Level 3 or above. Pacific peoples consistently had the smallest proportions at this level (less than a third in each domain). Māori had a larger proportion than other non-European ethnic groups in prose literacy at Level 3 or above but a smaller proportion in the document and quantitative literacy domains.
Table K4.1 Proportion (%) of adults aged 16-65 years with higher level literacy skills (Level 3 or above), 1996
| Prose literacy | Document literacy | Quantitative literacy | |
|---|---|---|---|
| European | 61 | 56 | 57 |
| Māori | 36 | 30 | 30 |
| Pacific | 27 | 25 | 28 |
| Other | 32 | 34 | 37 |
| Total | 54 | 50 | 51 |
Source: Ministry of Education (2001b)
Among Māori and Pacific adults, there were considerable sex differences favouring males in the document and quantitative domains that were not evident among Europeans. For example, only 18 percent of Pacific females were at Level 3 or above for quantitative literacy compared with 42 percent of Pacific males. The sex disparity was not as great among Māori but was still substantial, with 26 percent of females at Level 3 or above for quantitative literacy compared with 36 percent of males.37
International Comparison
New Zealand's prose literacy rate of 54.2 percent was close to the OECD median of 53.5, and placed New Zealand seventh out of 17 OECD countries.38 The top prose literacy performer in the OECD was Sweden (72.1). Outcomes for other countries include Canada (57.8), Australia (55.8), the United States (53.5) and the United Kingdom (47.9). New Zealand had a document literacy score of 49.5 percent, slightly lower than the OECD median of 52.9. This placed New Zealand 13th in the OECD for document literacy. Scores for other countries included: Canada (57.2), Australia (55.1), the United States (50.4) and the United Kingdom (49.6). Concerning quantitative literacy, New Zealand scored 50.6 percent. This was significantly lower than the OECD median of 57.0 and ranked New Zealand at 12th place. Canada scored 57.0, Australia (56.8), the United States (53.8) and the United Kingdom (49.0).39
