Relevance
Cultural activities are an integral part of leisure and recreation. People participate in cultural activities for a wide variety of reasons: for enjoyment and entertainment, for personal growth and development, as a means of expression, to learn new skills and to meet new people, and to pass on cultural traditions.
Current Level And Trends
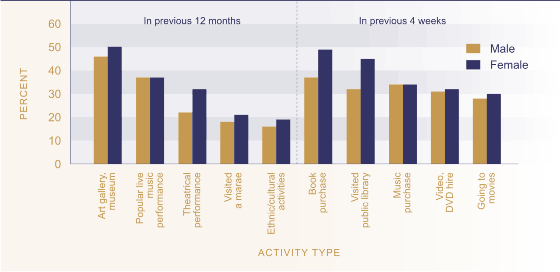
The vast majority of New Zealanders aged 15 and over (93 percent or 2.6 million people) experienced one or more of the cultural activities included in the 2002 Cultural Experiences Survey. The most popular of the less frequent activities included in the survey (those experienced over the past year) were visiting an art gallery or museum (48 percent) and attending a popular live music performance (37 percent). The most popular activities undertaken in the previous four weeks were purchasing books (43 percent) and visiting a public library (39 percent). Lack of time and cost were the main barriers to experiencing cultural activities more often, or at all.
Figure L3.1 Proportion of the population
aged 15 and over who experienced cultural activities, by activity type
& sex, 2001/02

Source: Statistics New
Zealand (2002a)
Sex And Age Differences
Women (95 percent) were slightly more likely to experience one or more of the cultural activities included in the survey than men (92 percent). Activities with a much higher proportion of women than men participating included purchasing a book, visiting a library, and going to a theatrical performance. There was no difference in the proportion of men and women who had purchased music.
Younger people were more likely to experience at least one of the cultural activities included in the survey than people in the older age groups. In 2002, virtually all 15-24 year-olds (98 percent) and 96 percent of 25-44 year-olds took part in one or more of the surveyed activities. Participation was lowest among the 65+ age group (81 percent). Popular activities among younger people included hiring a video or DVD (53 percent) and purchasing music (49 percent). Older people (65+ years) were more likely to visit a public library than other age groups, with 46 percent reporting this activity.
Ethnic Differences
Māori were more likely to have participated in at least one of the cultural activities included in the survey than the European or Pacific groups (Māori 97 percent; European 93 percent; Pacific 92 percent). Popular activities experienced by Māori included visiting a marae (69 percent) and attending a popular live music performance (40 percent). European New Zealanders were more likely to report visiting an art gallery or museum than other groups (51 percent), while Pacific people had the highest rate of participation in community-based ethnic or cultural activities (39 percent).
Table L3.1 Proportion (%) of population aged 15+ who had participated in cultural activities by activity type and ethnic group
| Māori | Pacific people | European | |
|---|---|---|---|
| In the previous 12 months | |||
| Art gallery/museum |
42 |
27 |
51 |
| Book purchase |
40 |
29 |
45 |
| Popular live music performance |
40 |
27 |
39 |
| Theatrical performance |
18 |
19 |
30 |
| Visited a marae |
69 |
22 |
14 |
| Community-based ethnic/cultural activities |
20 |
39 |
14 |
| In the previous four weeks | |||
| Visited public library |
34 |
31 |
39 |
| Music purchase |
32 |
33 |
34 |
| Video, DVD hire |
39 |
26 |
31 |
| Going to movies |
23 |
21 |
30 |
| Any cultural activity |
97 |
92 |
93 |
Source: Statistics New Zealand (2002a)
Regional Differences
In 2002, 94 percent of people living in urban areas experienced one or more of the cultural activities included in the survey, compared to 93 percent of people living in secondary urban areas and 91 percent of those living in minor urban and rural areas. Comparing across regional council areas, Wellington had the highest proportion of people who experienced at least one of the surveyed activities (97 percent), while Taranaki had the lowest level of participation (87 percent).
