Relevance
It is important that people find a balance between paid work and other aspects of life. When this balance is not found people can find themselves suffering from stress or anxiety. Long working hours or non-standard working hours (eg night shifts) may compromise work/life balance.
Current Level and Trends
Results from the Social Wellbeing Survey 2004, indicate that most employed New Zealanders (62 percent) are ‘satisfied’ or ‘very satisfied’ with their work/life balance. People in part-time employment (75 percent) are more likely to be ‘satisfied’ or ‘very satisfied’ with their work/life balance than people in full-time employment (56 percent).
Figure PW5.1 Satisfaction with work/life
balance, by employment status, 2004
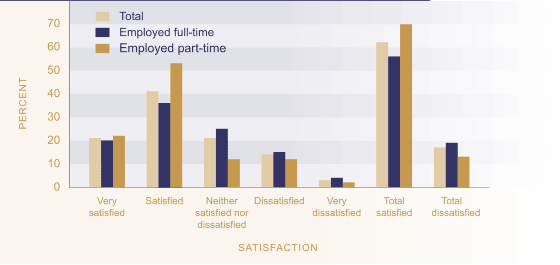
Source: Ministry of Social
Development (2004)
Age and Sex Differences
Those least likely to be satisfied with their work/life balance are people aged 15-24 years and 45-64 years (both have total satisfaction levels of 59 percent).
Females (66 percent) are more likely to report being satisfied with their work/life balance than males (57 percent). This difference partly reflects the fact that females are more likely to be in part-time work. Among full-time workers, males (55 percent) and females (57 percent) report similar levels of satisfaction with their work/life balance.
Ethnic Differences
Pacific people (65 percent) report the highest levels of satisfaction with work/life balance, followed by people of European ethnicity (63 percent). Māori (55 percent) and Other ethnicities (56 percent) reported lower levels of satisfaction. Across all ethnicities, hours of employment affect satisfaction with work/life balance, with those working part-time having higher levels of satisfaction than those working full-time.
Figure PW5.2 Levels of satisfaction with
work/life balance, 2004
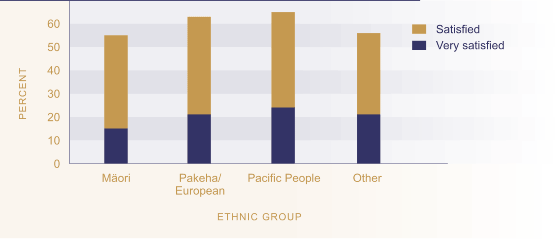
Source: Ministry of Social Development (2004)
Personal Income Differences
Reported levels of satisfaction with work/life balance tend to decline with higher levels of income. Those New Zealanders whose personal incomes are less than $20,000 are the most likely to be satisfied overall with their balance of work and life (71 percent), while those with incomes over $60,000 are the least likely (54 percent).
Figure PW5.3 Satisfaction with work/life
balance, by personal income, 2004
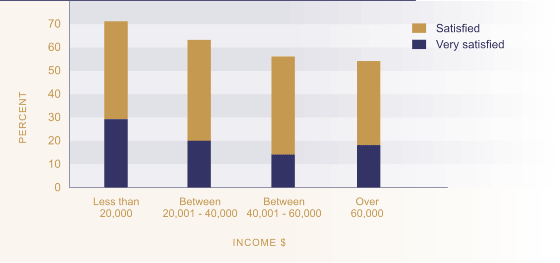
Source: Ministry of Social Development (2004)