The distribution of social wellbeing in New Zealand
Outcomes for Māori and Pacific peoples have improved since the mid-1990s against most of the indicators for which we have time-series data. This includes longer life expectancy, reduced rates of suicide (data for Māori population only), and higher rates of participation in early childhood and tertiary education. Unemployment and employment rates have also improved.
The proportion of families with a Māori adult with low income dropped from 32 percent in 2001 to 24 percent in 2004, and the proportion spending more than 30 percent of their income on housing costs declined from 32 percent to 21 percent over the same period. While the proportion of families with a Pacific adult with low income has changed little since 2001, the proportion spending more than 30 percent of their income on housing costs has dropped sharply from 41 percent to 23 percent.
As with the rest of the population, rates of obesity have grown since 1997, and there has been no improvement in the number of child maltreatment deaths (data for Māori population only).
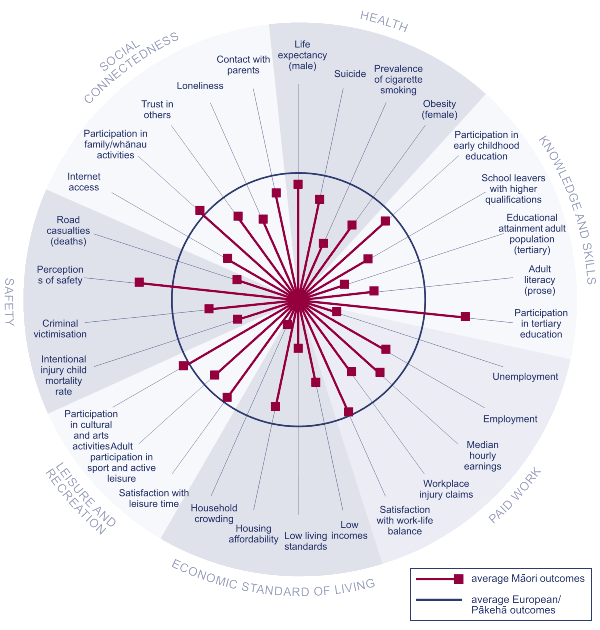
Against many of these indicators, improvements for Māori have been greater than for Europeans/Pākehā. This includes indicators of life expectancy, suicide, participation in early childhood and tertiary education, school leavers with higher qualifications, employment, unemployment, low incomes and housing affordability. While the effect of this has been to reduce the disparity in outcomes between the Māori and Pākehā/European populations, indicators of wellbeing for Māori are still relatively poor in a number of areas, and in particular Health, Paid Work and Economic Standard of Living. This is illustrated in Figure CO2.
Figure CO2 Social wellbeing for Māori, relative to Europeans/Pākehā

Interpreting "Social wellbeing for Māori, relative to Europeans/Pākehā"
The circle represents average outcomes for Europeans/Pākehā against each indicator and the spokes represent outcomes for Māori. Where a spoke falls outside of the circle this means outcomes for Māori are better than for Europeans/Pākehā; the further the spoke is from the circle the more pronounced the difference. Where a spoke falls within the circle, outcomes for Māori are worse than for Europeans/Pākehā; the further the spoke is from the circle the more pronounced this effect. There are, however, some important limitations on this style of presentation. In particular, we cannot directly compare the size of changes for different indicators.
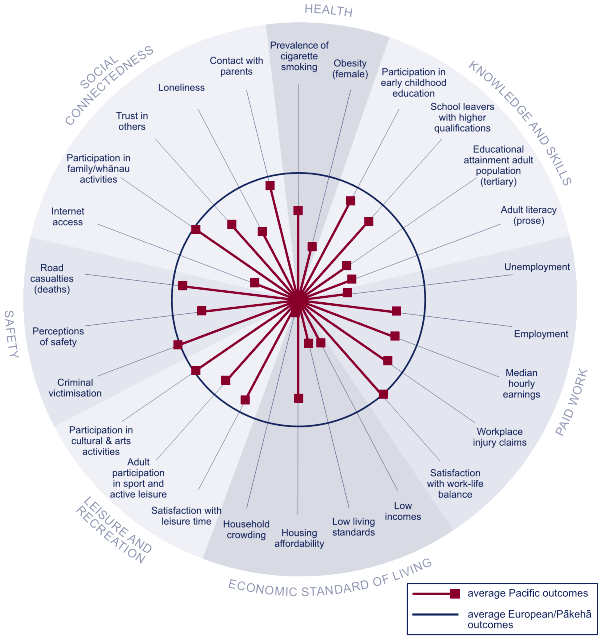
Improvements for Pacific peoples have been greater than for Europeans/Pākehā for a smaller number of indicators, including housing affordability, median hourly earnings, and participation in early childhood education. However, as shown in Figure CO3, outcomes for Pacific peoples are still relatively poor against the large majority of indicators.
Figure CO3 Social wellbeing for Pacific peoples, relative to Europeans/ Pākehā

Interpreting "Social wellbeing for Pacific peoples, relative to Europeans/Pākehā"
The circle represents average outcomes for Europeans/Pākehā against each indicator and the spokes represent outcomes for Pacific peoples. Where a spoke falls outside of the circle this means outcomes for Pacific peoples are better than for Europeans/Pākehā; the further the spoke is from the circle the more pronounced the difference. Where a spoke falls within the circle, outcomes for Pacific peoples are worse than for Europeans/Pākehā; the further the spoke is from the circle the more pronounced this effect. There are, however, some important limitations on this style of presentation. In particular, we cannot directly compare the size of changes for different indicators.
The limited set of indicators that enables us to look at the outcomes for people who identify with ethnicities other than European/Pākehā, Māori or Pacific peoples show a mixed picture.
People who identify with an ethnic group other than European/Pākehā, Māori or Pacific peoples tend to perform well on average in the area of Knowledge and Skills, and have relatively low rates of smoking. While employment, unemployment and median hourly earnings outcomes for people in this group are better than for the Māori and Pacific populations, they are not as good as for Pākehā/Europeans.
Families with an adult of "Other" ethnicity were the only group to experience an increase in the proportion of people on low incomes and in the proportion of people spending more than 30 percent of their income on housing between 2001 and 2004. Outcomes for this group are now worse for these two indicators than for any other ethnic group.
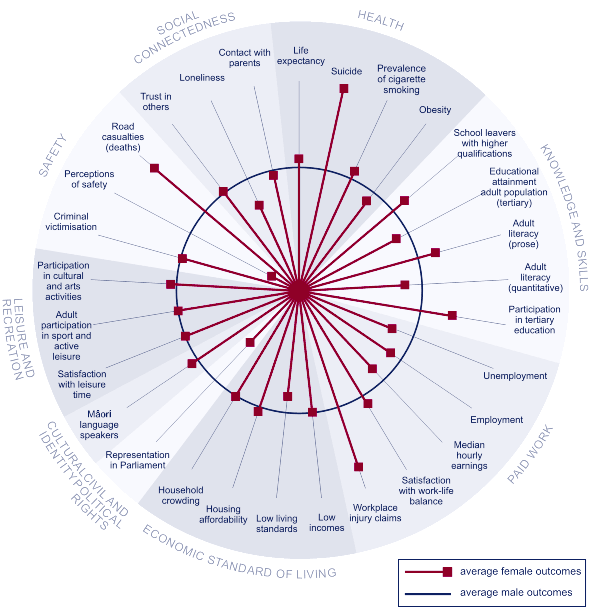
Women have significantly lower representation in Parliament than men and are less likely than men to feel safe in their communities. Unemployment rates are slightly higher among women than men, and women are more likely to have low living standards and lower median hourly earnings. However, growth in real median hourly earnings since 1997 for women has been double the growth rate experienced by men. Since the mid-1990s, the employment rate gap between males and females has narrowed. While between the mid-1990s and 2001 women were slightly more likely than men to be on low incomes and to be spending more than 30 percent of their income on housing costs, by 2004 these differences in outcomes had virtually disappeared. Rates of obesity are higher among the female population, but this gap has narrowed due to a growth in male obesity rates since 1997.
Men have higher rates of suicide and lower life expectancy and health expectancy than women. The sex gap in outcomes for life expectancy and suicide has narrowed since the mid-1990s, but has increased for health expectancy. Men are more likely than women to experience a workplace or road traffic injury, and are less likely than women to leave school with higher qualifications or to participate in tertiary study. The gap in outcomes for these last two indicators has widened over the past decade.
Figure CO4 Social wellbeing for women, relative to men

Interpreting "Social wellbeing for women, relative to men"
The circle represents average outcomes for men against each indicator and the spokes represent outcomes for women. Where a spoke falls outside of the circle this means outcomes for women are better than for men; the further the spoke from the circle the more pronounced the difference. Where a spoke falls within the circle outcomes for women are worse than for men; the further the spoke is from the circle the more pronounced this effect. There are, however, some important limitations on this style of presentation. In particular, we cannot directly compare the size of changes for different indicators.
The proportion of children living in low-income families declined from 27 percent in 2001 to 21 percent in 2004. Child poverty rates are still higher, however, than for the rest of the population (19 percent) and other indicators show children are more likely than adults to live in families with low living standards, families that are spending more than 30 percent of their incomes on housing, and families living in crowded housing.
Younger people are considerably more likely to experience criminal victimisation and road casualties, and are more than twice as likely as older age groups to be unemployed.
People aged 65 and over have relatively good outcomes in the Economic Standard of Living domain. They also have lower rates of obesity, smoking and suicide than young people. However, older people are less likely to have higher qualifications, to participate in family activities, or to participate in cultural activities.
|


