Language retention
Definition
The proportion of people who can speak a "first language" (excluding English)
of their ethnic group, for ethnic groups (other than Māori) with an established resident population in New Zealand, as recorded in the
2001 Census. The ability to speak a language is defined as being able to
hold an everyday conversation in that language. "First language" refers
to an indigenous language associated with a given ethnicity, as opposed
to the first language of a person. Sign language is not treated as a "first
language" for the purposes of this indicator.
Relevance
The ability to speak the language of one's identified ethnicity is an indicator
of the ability to retain and pass on one's culture and traditions to future
generations. Language is a central component of cultural identity.
Current level
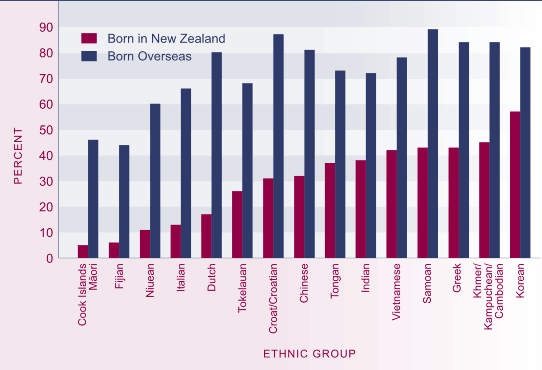
In 2001, the proportion of people who could hold an everyday conversation in the "first language" of their ethnic group varied widely between ethnic groups, from 17 percent of Cook Islands Māori to 81 percent of Koreans. In all ethnic groups, those who were born in New Zealand were less likely to be able to speak the "first language" than those
who were born overseas.
Figure Cl3.1 Proportion of people who could speak the "first language" of their ethnic group, by birthplace, 2001

Source: Statistics New Zealand (2004g)
Age and sex differences
In all ethnic groups, young people were less likely than older people to be
able to hold an everyday conversation in the "first language" of their ethnic
group. The proportions were similar for males and females.
Table CI3.1 Proportion (%) of people in selected ethnic groups who can speak the "first language" of their ethnic group, by age group and sex, 2001
| |
Age (years) |
Sex |
Total |
| |
0-24 |
25-49 |
50+ |
Males |
Females |
|
| Pacific peoples |
| Samoan |
50 |
75 |
89 |
61 |
64 |
62 |
| Cook Island Māori |
7 |
26 |
53 |
16 |
18 |
17 |
| Tongan |
44 |
66 |
73 |
53 |
54 |
54 |
| Tokelauan |
27 |
57 |
76 |
38 |
43 |
40 |
| Niuean |
13 |
38 |
61 |
24 |
27 |
26 |
| Fijian (except Fiji Indian/Indo-Fijian) |
14 |
36 |
50 |
26 |
26 |
26 |
| Asian |
| Indian |
50 |
70 |
74 |
61 |
63 |
62 |
| Chinese |
59 |
75 |
82 |
67 |
71 |
69 |
| Khmer/Kampuchean/Cambodian |
67 |
85 |
87 |
73 |
79 |
76 |
| Vietnamese |
60 |
82 |
84 |
69 |
74 |
72 |
| Korean |
78 |
84 |
84 |
80 |
82 |
81 |
| European |
| Dutch/Netherlands |
21 |
63 |
81 |
59 |
60 |
59 |
| Greek (incl. Greek Cypriot) |
27 |
73 |
89 |
64 |
61 |
63 |
| Croat/Croatian |
41 |
70 |
81 |
66 |
63 |
65 |
| Italian |
13 |
44 |
70 |
39 |
35 |
37 |
Source: Statistics New Zealand, 2001 Census, unpublished data
|

