Potentially hazardous drinking
Definition
The proportion of the population aged 15 years and over who drink alcohol, who scored eight or more on the Alcohol Use Disorders Identification Test (AUDIT), as measured in the New Zealand Health Surveys conducted by the Ministry of Health in 1996/1997, 2002/2003 and 2006/2007.
The AUDIT is a 10-item questionnaire covering alcohol consumption, alcohol-related problems and abnormal drinking behaviour.
Relevance
Potentially hazardous drinking, defined by an AUDIT score of eight or more, is an established pattern of alcohol consumption that carries a high risk of future damage to physical or mental health, but may not yet have resulted in significant adverse effects.43 Alcohol also contributes to death and injury due to traffic accidents, drowning, suicide, assaults and domestic violence.44
Current level and trends
In 2006/2007, 22.9 percent of drinkers aged 15 years and over had a potentially hazardous drinking pattern, as indicated by an AUDIT score of eight or more.
This was similar to the proportions recorded in the 1996/1997 and 2002/2003 surveys (22.3 percent and 22.5 percent, respectively).45
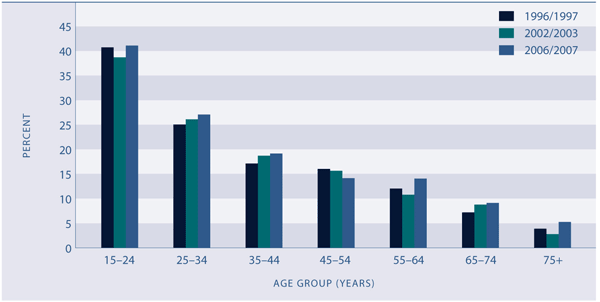
Figure H6.1 Potentially hazardous drinking among drinkers, by age, 1996/1997, 2002/2003, 2006/2007

Source: Ministry of Health, Public Health Intelligence
Age and sex differences
For both males and females, the proportion of drinkers with a potentially hazardous drinking pattern is highest among those aged 15–24 years and declines at older ages.
In 2006/2007, male drinkers (29.2 percent) were significantly more likely than female drinkers (13.0 percent) to have a potentially hazardous drinking pattern.
This was the case for all age groups and in each survey year.
Table H6.1 Proportion (%) of drinkers with a potentially hazardous drinking pattern, by age group and sex, 1996/1997, 2002/2003, 2006/2007
| |
15–24 |
25–34 |
35–44 |
45–54 |
55–64 |
65–74 |
75+ |
| 1996/1997 |
| Male |
49.8 |
35.7 |
25.5 |
25.2 |
21.1 |
12.6 |
7.3 |
| Female |
31.6 |
13.9 |
8.1 |
6.0 |
1.8 |
1.0 |
0.8 |
| Total |
40.8 |
24.9 |
17.1 |
16.0 |
12.0 |
7.3 |
3.9 |
| 2002/2003 |
| Male |
45.8 |
36.1 |
28.0 |
23.5 |
18.1 |
16.4 |
4.4 |
| Female |
31.0 |
16.0 |
9.3 |
7.1 |
3.0 |
1.1 |
1.0 |
| Total |
38.7 |
26.1 |
18.7 |
15.7 |
10.8 |
8.7 |
2.7 |
| 2006/2007 |
| Male |
49.2 |
36.2 |
29.0 |
21.1 |
23.1 |
14.7 |
7.9 |
| Female |
32.6 |
18.2 |
9.5 |
7.3 |
4.3 |
3.0 |
2.5 |
| Total |
41.1 |
27.1 |
19.2 |
14.2 |
14.0 |
9.1 |
5.2 |
Source: Ministry of Health, Public Health Intelligence
Ethnic differences
Māori and Pacific drinkers are significantly more likely than drinkers in the total population to have a potentially hazardous drinking pattern. Asian drinkers are significantly less likely to have such a pattern. These ethnic differences are evident for both sexes.
Table H6.2 Age-standardised potentially hazardous drinking prevalence rate (%), for drinkers, aged 15 years and over by ethnic group and sex, 1996/1997, 2002/2003, 2006/2007
| |
European/Other |
Māori |
Pacific
peoples |
Asian |
Total 15+ |
| 1996/1997 |
| Male |
31.0 |
46.1 |
48.2 |
11.6 |
30.9 |
| Female |
12.0 |
30.6 |
20.8 |
5.1 |
13.3 |
| Total |
21.6 |
38.3 |
38.1 |
9.4 |
22.3 |
| 2002/2003 |
| Male |
29.9 |
42.4 |
44.1 |
11.5 |
30.6 |
| Female |
13.3 |
24.1 |
24.3 |
4.8 |
14.2 |
| Total |
21.7 |
32.9 |
36.1 |
8.6 |
22.5 |
| 2006/2007 |
| Male |
32.1 |
46.8 |
46.6 |
12.9 |
31.2 |
| Female |
14.5 |
28.5 |
25.8 |
3.8 |
14.7 |
| Total |
23.1 |
37.5 |
37.7 |
8.9 |
22.9 |
Source: Ministry of Health, Public Health Intelligence
Notes: (1) Rates are age-standardised using the WHO world population (2) People who reported more than one ethnic group are counted once in each group reported
Socio-economic differences
The proportion of drinkers aged 15 years and over with a potentially hazardous drinking pattern in 2006/2007 was significantly higher (at 30.8 percent) in the most deprived small areas (NZDep2006 quintile 5) than in all other areas (quintiles 1–4), where proportions ranged from 19–24 percent.
International comparison
Because of the paucity of international data using the AUDIT method of identifying potentially hazardous drinking, this section uses information on annual per capita alcohol consumption compiled by the OECD. New Zealand had the 14th lowest level of alcohol consumption out of 30 OECD countries in 2003–2006, with a per capita consumption of 9.4 litres in 2006. New Zealand’s alcohol consumption was higher than that of the United States (8.4 litres in 2005) and Canada (8.0 litres in 2005), similar to that of Australia (9.8 litres in 2005), but lower than that of the United Kingdom (10.9 litres in 2006). The OECD median in 2003–2006 was 9.8 litres of alcohol per person.
|

