Satisfaction with leisure time
Definition
The proportion of people aged 15 years and over who are "satisfied" or "very satisfied" with their leisure time as reported in the Quality of Life Survey 2006.
Relevance
Leisure time is a crucial component of a balanced and healthy lifestyle. It is a time when people can do what they want to, separate from work and other commitments.
Current level
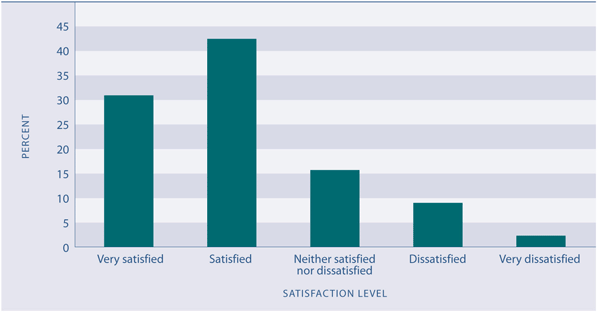
According to the Quality of Life Survey 2006, almost three-quarters of New Zealanders (73 percent) were satisfied overall with their leisure time. Of these, 42 percent were satisfied and 31 percent were very satisfied.
Figure L1.1 Satisfaction with leisure time, people aged 15 years and over, 2006

Source: Quality of Life Survey 2006
Age differences
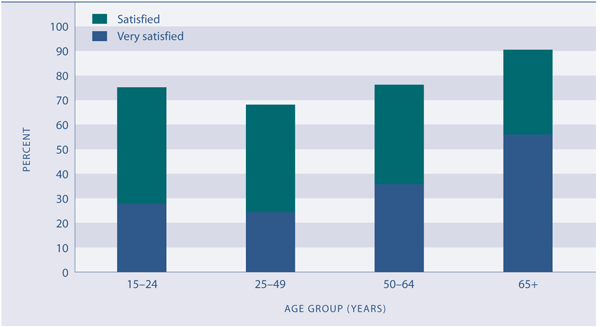
While the majority of New Zealanders were satisfied with their leisure time, those aged 25–49 years were less satisfied overall (67 percent). This age group tends to have larger work and family commitments than other groups, which may impinge on the time available for leisure. In comparison, those aged 15–24 years and those aged 50–64 years were more likely to report being satisfied with their leisure time, with total satisfaction levels of 75 percent and 76 percent respectively. People aged 65 years and over reported the highest levels of overall satisfaction with their leisure time (90 percent).
Figure L1.2 Satisfaction with leisure time, by age, 2006

Source: Quality of Life Survey 2006
Sex differences
There was little difference between the sexes in reported satisfaction with leisure time. Seventy-four percent of men and 72 percent of women reported they were satisfied or very satisfied with their leisure time.
Ethnic differences
Most New Zealanders, regardless of their ethnicity, were satisfied with their leisure time. In 2006, the European ethnic group (75 percent) and Pacific peoples (73 percent) had higher levels of satisfaction with their leisure time than Māori (68 percent) or Asian New Zealanders (63 percent). The small remaining group of people from the Other ethnic group reported the highest level of total satisfaction (76 percent).
Socio-economic differences
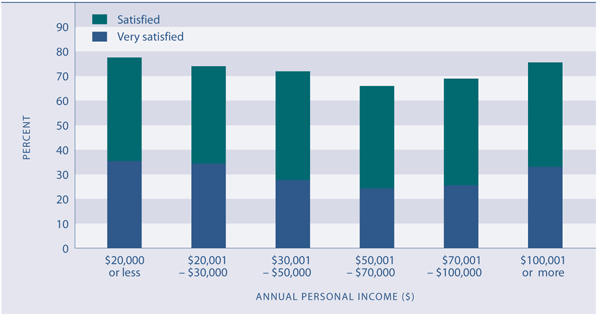
People’s levels of satisfaction with their leisure time varied slightly by the levels of their personal income, but not in a consistent way. In 2006, satisfaction with leisure time was highest for people with an annual personal income of $20,000 or less, with 77 percent of the people in this income range saying they were either very satisfied or satisfied with their leisure time. Two income groups had below average levels of satisfaction – those with a personal income between $50,001 and $70,000 (66 percent), and those with an income between $70,001 and $100,000 (69 percent).
Figure L1.3 Satisfaction with leisure time, by personal income, 2006

Source: Quality of Life Survey 2006 |


