Household crowding
Definition
The proportion of the population living in crowded housing (ie requiring
one or more additional bedrooms, as defined by the Canadian Crowding Index).
The Canadian Crowding Index is a proxy measure to monitor the incidence
of "crowding" in the population.
Relevance
Housing space adequate to the needs and desires of
a family is a core component of quality of life. National and international
studies indicate an association between the prevalence of certain infectious
diseases and crowding58 as well as between crowding and poor educational
attainment. Crowding can also contribute to psychological stress for people
in the households
concerned.
Current level and trends
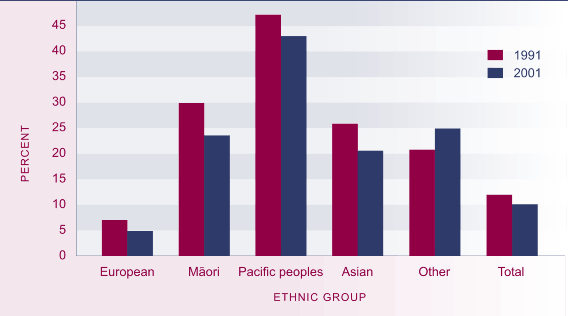
In 2001, 348,400 people, or 10 percent of the New Zealand resident population, lived in households requiring one or more additional bedrooms
to accommodate household members adequately, based on the criteria in the Canadian
Crowding Index (see Appendix 2). The number of people in crowded households
has reduced since 1991, when 379,900 people or 12 percent of the population
were living in crowded conditions.
The Canadian Crowding Index also shows how many people live in houses
where two or more bedrooms are required. In 2001 there were 109,000 people
or 32 percent of usual residents in this situation, compared to 113,000 or
35 percent in 1991.
Figure EC6.1 Proportion of population living in households requiring
at least one additional
bedroom, by ethnic group, 1991 and 2001

Source: Statistics New Zealand
Age and sex differences
Household crowding is more likely to be experienced
by younger people than older people. In 2001, 17 percent of children under
the age of 10 years lived in households requiring at least one more bedroom,
compared
to 15 percent of 10–14 year olds. Among all adults aged 15 and over, 8 percent
lived in crowded households but this ranged from 16 percent of 15–24 year olds,
to 9 percent of 25–44 year olds, 5 percent of 45–64 year olds and just 2 percent
of those aged 65 and over.
Between 1991 and 2001 there was a decrease, from 17 percent to 16 percent,
in the proportion of children under the age of 18 living in crowded households,
defined by needing one or more additional bedrooms. However, there has been
no change in the proportion of this age group living in more severe crowding
levels where at least two more bedrooms were required (5 percent in both 1991
and 2001).
There is very little difference by sex in the likelihood of living in
crowded households.
Ethnic differences
Pacific peoples are far more likely to be living
in crowded households than other ethnic groups. In 2001, a total of 43 percent
of Pacific peoples lived in households requiring extra bedrooms. People in
the "Other" ethnic group were the next most likely, with 25 percent requiring at least one
extra bedroom, followed by Māori (23 percent) and Asians (20 percent). Partly reflecting their older age
profile, only 5 percent of European New Zealanders were living in houses
that met
the definition of crowding used here. The "Other" ethnic group was the only ethnic group to have an increased incidence of crowding
between 1991 and 2001. One possible explanation for this trend is that recent
migrants, common in this ethnic group, are more likely to live in crowded
households.59
The largest group of those living in households requiring at least one
extra bedroom were those who identified as European (38 percent), followed
by Māori (34 percent), Pacific peoples (28 percent), Asian (14 percent) and the "Other" ethnic group (just 2 percent).60 However, of those living in more severe crowding
situations (households requiring two or more bedrooms), Pacific peoples and
Māori made up the largest groups (41 percent and 38 percent, respectively).
Cultural attitudes and economic conditions are two primary factors which
account for the extreme variation in crowding levels between ethnic groups.
The variance in population age structures is also a factor: the Māori and Pacific peoples ethnic groups both have younger age structures than the
European population.
Regional differences
There is a considerable variation across the
country in household crowding. Whether measured by population or household, Manukau City has
by far the worst level of household crowding (24 percent of people, 13 percent
of households required one or more bedrooms in 2001). The next worst levels
were in Opotiki District and Porirua City, where almost one in five people, and one in 10 households, required at least
one more bedroom. Other local authority areas with relatively high levels
of crowding were Auckland City and the Far North, Wairoa and Kawerau Districts. All of the South Island local authorities had lower than average levels of household crowding.
Socio-economic differences
Unemployed people are more likely to be living in crowded
households than those with full-time jobs (20 percent and 6 percent, respectively).
Other groups with crowding levels above the average adult level of 8 percent
include those with no qualifications (10 percent) and those who receive income
support (16 percent).61
There is a clear correlation between levels of income and levels of crowding:
in 2001, 6 percent of households in the bottom quartile of equivalised household
income required one or more bedrooms, compared with 2 percent of those in the
top income quartile.
Households in rental accommodation were more likely to be crowded (11
percent) than those in dwellings owned with a mortgage (4 percent) or mortgage-free
(2 percent).
|

