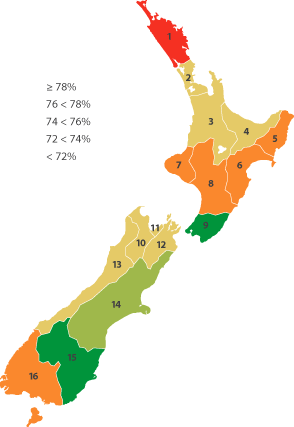
Educational attainment of the adult population
Definition: The proportion of adults aged 25–64 years with an educational attainment of at least upper secondary school level. At least upper secondary school level includes any formal qualification at NCEA Level 1 (or its predecessor, School Certificate) or higher.

Percentage of adults aged 25-64 years with higher qualifications, selected years, 1986-2009
At least upper secondary
| Region |
1986 |
1991 |
1996 |
2001 |
2002 |
2003 |
2004 |
2005 |
2006 |
2007 |
2008 |
2009 |
| 1 |
Northland |
49.5 |
61.3 |
61.9 |
65.7 |
67.3 |
69.9 |
69.6 |
69.7 |
68.3 |
72.7 |
71.5 |
71.3 |
| 2 |
Auckland |
59.2 |
64.0 |
70.2 |
74.2 |
72.7 |
75.4 |
76.1 |
75.7 |
74.0 |
75.5 |
74.3 |
74.0 |
| 3 |
Waikato |
51.1 |
59.2 |
63.4 |
69.6 |
71.5 |
73.1 |
72.3 |
72.8 |
72.9 |
74.2 |
74.2 |
75.0 |
| 4 |
Bay of Plenty |
52.5 |
62.2 |
64.9 |
69.6 |
72.8 |
74.0 |
74.1 |
71.3 |
74.5 |
74.5 |
73.5 |
74.2 |
| 5 |
Gisborne |
54.2 |
53.8 |
63.4 |
65.3 |
66.6 |
68.6 |
67.6 |
67.7 |
72.4 |
72.5 |
72.9 |
72.7 |
| 6 |
Hawke’s Bay |
| 7 |
Taranaki |
49.1 |
55.0 |
64.7 |
68.3 |
70.5 |
74.2 |
71.7 |
72.3 |
70.4 |
69.7 |
70.2 |
72.7 |
| 8 |
Manawatu-Whanganui |
52.3 |
59.7 |
65.0 |
66.7 |
66.0 |
67.8 |
66.1 |
67.4 |
67.7 |
70.4 |
71.2 |
72.3 |
| 9 |
Wellington |
64.4 |
67.5 |
72.1 |
78.4 |
79.5 |
78.3 |
78.9 |
80.8 |
78.6 |
80.4 |
78.9 |
79.7 |
| 10 |
Tasman |
54.0 |
61.8 |
65.0 |
68.0 |
71.6 |
73.4 |
77.2 |
76.5 |
77.1 |
78.1 |
76.8 |
75.0 |
| 11 |
Nelson |
| 12 |
Marlborough |
| 13 |
West Coast |
| 14 |
Canterbury |
57.5 |
66.3 |
72.1 |
76.2 |
76.6 |
75.9 |
77.6 |
78.5 |
76.3 |
77.2 |
77.7 |
77.5 |
| 15 |
Otago |
59.4 |
57.8 |
65.8 |
73.8 |
73.4 |
74.4 |
77.8 |
80.2 |
76.7 |
79.0 |
80.9 |
79.8 |
| 16 |
Southland |
44.0 |
54.1 |
58.9 |
63.1 |
65.6 |
67.5 |
68.4 |
70.5 |
71.5 |
72.2 |
73.4 |
72.5 |
| New Zealand |
56.4 |
62.2 |
67.9 |
72.4 |
72.9 |
74.2 |
74.8 |
75.2 |
74.3 |
75.7 |
75.2 |
75.3 |
Source: Statistics New Zealand, Household Labour Force Survey. Revised data for all years.
Notes: (1) Average for December years. (2) At least upper secondary equals NCEA Level 1 (or its predecessor, School Certificate) or higher.
Tertiary (bachelor's degree or higher)
| Region |
1986 |
1991 |
1996 |
2001 |
2002 |
2003 |
2004 |
2005 |
2006 |
2007 |
2008 |
2009 |
| 1 |
Northland |
2.7 |
4.3 |
3.8 |
7.4 |
6.9 |
6.1 |
8.5 |
10.3 |
8.8 |
12.1 |
12.1 |
11.9 |
| 2 |
Auckland |
5.6 |
9.8 |
13.4 |
16.1 |
17.9 |
20.1 |
22.2 |
25.2 |
24.1 |
26.2 |
25.9 |
26.8 |
| 3 |
Waikato |
3.2 |
6.0 |
8.3 |
9.3 |
9.7 |
11.9 |
12.4 |
13.8 |
15.8 |
17.6 |
17.3 |
18.3 |
| 4 |
Bay of Plenty |
4.4 |
5.0 |
4.9 |
6.5 |
7.9 |
8.5 |
8.2 |
8.6 |
10.2 |
14.2 |
13.5 |
13.3 |
| 5 |
Gisborne |
2.6 |
3.3 |
4.5 |
7.1 |
8.9 |
9.6 |
10.3 |
10.6 |
11.6 |
12.8 |
12.9 |
14.2 |
| 6 |
Hawke’s Bay |
| 7 |
Taranaki |
2.5 |
2.7 |
5.4 |
5.2 |
7.3 |
8.2 |
8.2 |
10.3 |
9.8 |
11.7 |
12.6 |
13.0 |
| 8 |
Manawatu-Whanganui |
4.3 |
6.6 |
5.8 |
11.0 |
10.7 |
11.9 |
12.9 |
14.7 |
13.2 |
14.8 |
15.0 |
16.5 |
| 9 |
Wellington |
10.9 |
14.3 |
17.0 |
21.3 |
21.5 |
22.1 |
21.6 |
24.7 |
28.0 |
30.3 |
28.8 |
31.3 |
| 10 |
Tasman |
4.0 |
6.4 |
5.5 |
8.5 |
8.5 |
7.9 |
10.5 |
13.2 |
13.2 |
16.6 |
16.2 |
15.2 |
| 11 |
Nelson |
| 12 |
Marlborough |
| 13 |
West Coast |
| 14 |
Canterbury |
5.8 |
8.2 |
9.8 |
13.6 |
13.4 |
14.5 |
16.6 |
19.2 |
18.1 |
20.1 |
20.4 |
21.2 |
| 15 |
Otago |
6.9 |
8.6 |
10.7 |
12.3 |
12.3 |
14.1 |
17.4 |
19.6 |
20.3 |
22.6 |
24.9 |
23.7 |
| 16 |
Southland |
2.7 |
3.7 |
6.7 |
5.5 |
4.9 |
5.3 |
5.9 |
9.0 |
11.3 |
14.3 |
13.1 |
13.5 |
| New Zealand |
5.4 |
8.2 |
10.3 |
13.1 |
13.9 |
15.3 |
16.7 |
19.0 |
19.2 |
21.4 |
21.2 |
22.0 |
Source: Statistics New Zealand, Household Labour Force Survey. Revised data for all years
Notes: (1) Average for December years. (2) Tertiary equals bachelor's degree or higher. |