The indicators used in The Social Report 2004 enable us to compare how social wellbeing differs across broad groups within the New Zealand population. It is worth noting however, that these comparisons are for population group averages, and that in most cases, the variation in outcomes between members of any one group will be much greater than between group averages.
The overall risk of mortality and incidence of disability increases with age. Older people are less likely to have higher qualifications or higher literacy levels. Those aged 65 years or more are also less likely to participate in family activities, engage in cultural and arts activities, or to have internet access.
Employment levels and average earnings from wage and salary jobs peak in the 'middle years'. However, this group also reports the greatest dissatisfaction with work/life balance and available leisure time.
Younger people report higher levels of loneliness. They are more likely than older age groups to be subject to criminal victimisation and road casualties. Younger people also have the highest rates of unemployment and the lowest rates of voting in general elections.
The risk of poverty, low living standards and household crowding are all greater for children.
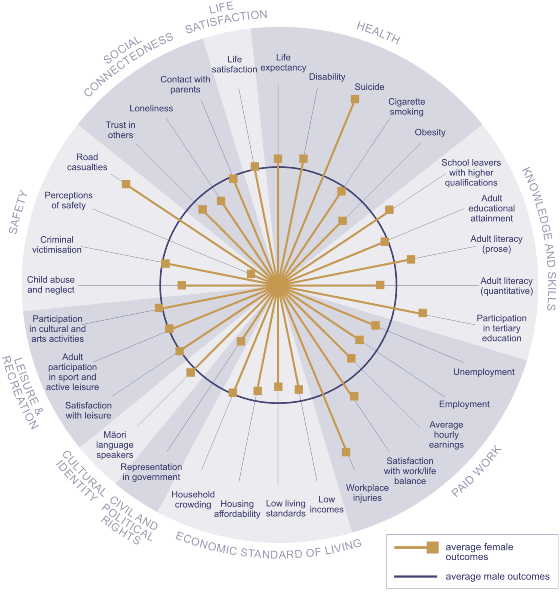
Men have a lower life expectancy and higher rates of suicide. Men also have higher rates of workplace injury and of death and injury from road crashes. They are less likely than women to leave school with higher qualifications, have lower rates of tertiary participation, and indicate that they are more concerned about their work/life balance.
Women have much lower levels of representation in local and central government than men. Women also have lower rates of employment than men, lower hourly wages and a higher risk of poverty. Girls are less likely than boys to participate in active leisure, while women have higher rates of obesity.
There is no reported difference in overall levels of victimisation between men and women. However, girls are more likely than boys to be subject to child abuse and neglect, and women are more likely to report feeling unsafe than men. Women are also slightly less trusting of others, and are more likely to report experiencing loneliness than men.
Figure CO3 Social wellbeing for women,
relative to men

| Interpreting 'Social wellbeing for women, relative to men' |
|---|
| The outer circle represents average male outcomes against each indicator, and the spokes represent outcomes for women. Where a spoke falls outside of the circle, this means that outcomes for women are better than for men; the further the spoke from the circle, the more pronounced the difference. Where a spoke falls within the circle, outcomes for women are worse than for men; the further the spoke is from the outer circle, the more pronounced this effect. There are, however, some important limitations on this style of presentation. In particular, we cannot directly compare the size of changes for different indicators. |
There are clear ethnic differences across a range of indicators of social wellbeing
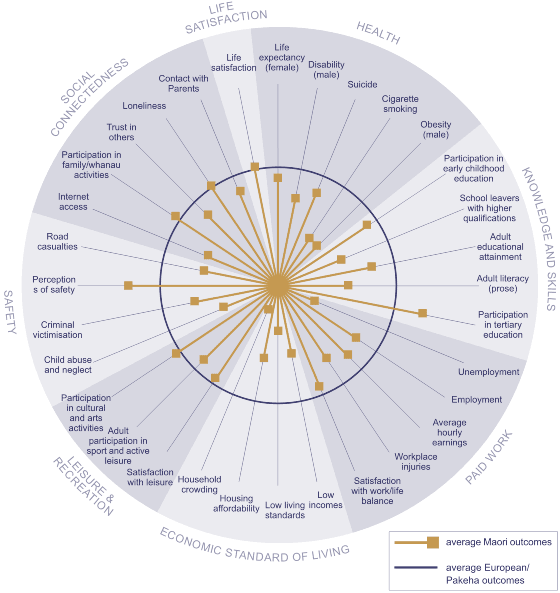
The majority of indicators for which we have time series data show social wellbeing improving for Māori since the mid 1990s. In many instances improvements for Māori have been greater than for Europeans/Pākehā. For example, the gaps between Maori and Europeans/Pākehā for life expectancy, tertiary participation, and unemployment have narrowed since the mid 1990s.
Wellbeing for Māori is however still relatively poor in the areas of health, paid work and economic standards of living. Māori report feeling safer than Europeans/Pākehā, but have higher levels of criminal victimisation, child abuse and neglect, and are more likely to be injured or killed in road crashes.
The difference in outcomes is less pronounced in the knowledge and skills area, with Maori being more likely than Europeans/Pākehā to participate in tertiary education. However, Māori are less likely than Europeans/Pākehā to participate in early childhood education, less likely to leave school with higher qualifications, and have lower levels of adult literacy.
Maori report slightly more participation in cultural and arts activities and family/whānau activities than Europeans/Pākehā.
Figure CO4 Social wellbeing for Māori,
relative to Europeans/Pākehā

| Interpreting 'Social wellbeing for Māori, relative to Europeans/Pākehā' |
|---|
| The outer circle represents average outcomes for Europeans/Pākehā against each indicator and the spokes represent outcomes for Māori. Where a spoke falls outside of the circle this means that outcomes for Māori are better than for Europeans/Pākehā; the further the spoke from the circle the more pronounced the difference. Where a spoke falls within the circle outcomes for Māori are worse than for Europeans/Pākehā; the further the spoke is from the outer circle the more pronounced this effect. There are, however, some important limitations on this style of presentation. In particular we cannot directly compare the size of changes for different indicators. |
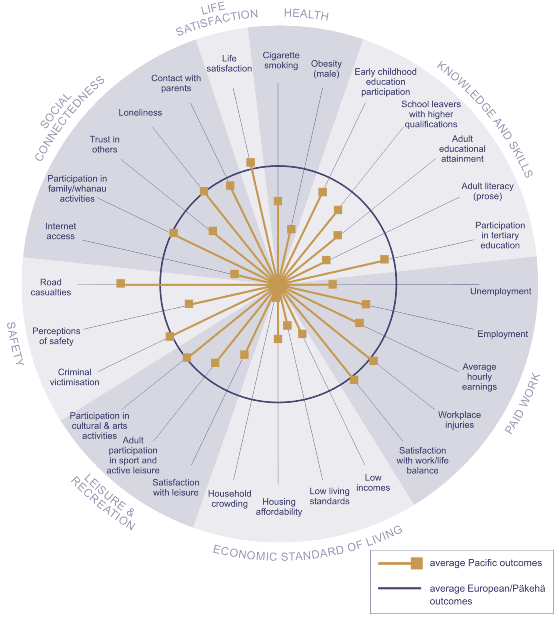
The majority of indicators for which we have time series data, show social wellbeing has also improved for Pacific peoples since the mid 1990s. There has also been a reduction in the gap between Pacific peoples and Europeans/Pākehā for some indicators, including unemployment and educational attainment.
Pacific peoples however still have higher levels of unemployment, and are at greater risk of poverty and household crowding than Europeans/Pākehā. Pacific adults report lower levels of participation in active sport and leisure and have higher rates of cigarette smoking and obesity than Europeans/Pākehā. Pacific peoples also do relatively poorly in the area of knowledge and skills.
Pacific people are less likely to be injured or killed on our roads, and there are few reported differences in levels of criminal victimisation.
Figure CO5 Social wellbeing for Pacific
peoples, relative to Europeans/Pākehā

| Interpreting 'Wellbeing for Pacific peoples relative to Europeans/Pākehā' |
|---|
| The outer circle represents average outcomes for Europeans/Pākehā against each indicator and the spokes represent outcomes for Pacific peoples. Where a spoke falls outside of the circle this means that outcomes for Pacific peoples are better than for Europeans/Pākehā; the further the spoke from the circle the more pronounced the difference. Where a spoke falls within the circle outcomes for Pacific peoples are worse than for Europeans/Pākehā; the further the spoke is from the outer circle the more pronounced this effect. There are, however, some important limitations on this style of presentation. In particular we cannot directly compare the size of changes for different indicators. |
Only a limited number of indicators enable us to look at the outcomes for New Zealanders who identify with an ethnic group other than European/Pākehā, Māori, or Pacific. Those that do, show a mixed picture. People of 'other' ethnicity generally perform well in the area of knowledge and skills, particularly for tertiary participation and educational attainment. They are also more likely to take part in sport and active leisure, and to be satisfied with their leisure time. However, people of 'other' ethnicity are more likely than Europeans/Pakeha to be unemployed and to have a low standard of living. They may also be more socially isolated than other ethnic groups - they have higher rates of loneliness, and are less likely to have family and friends over for dinner.
People living in materially deprived communities have a lower life expectancy, higher rates of cigarette smoking and obesity, and lower levels of educational achievement. Adults with low incomes are less likely to vote. Low income families are also less likely than those on higher incomes to have internet connections, while adults with low incomes report higher levels of loneliness, and lower levels of trust in others.
