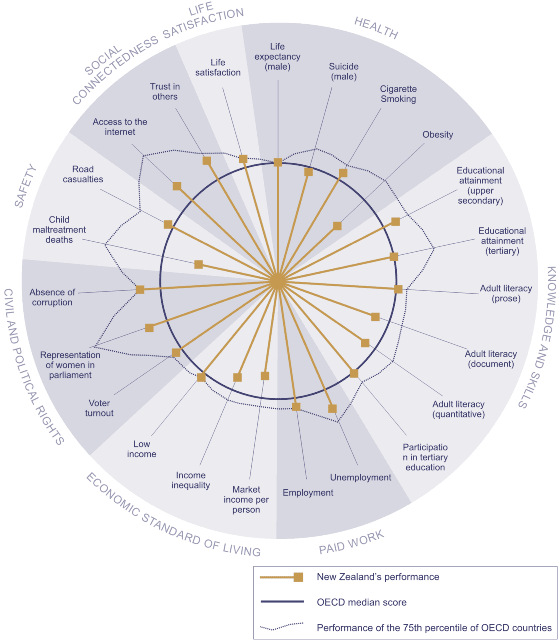
Figure CO2 Social wellbeing in New
Zealand relative to the OECD

| Interpreting 'Social wellbeing in New Zealand relative to the OECD' |
|---|
|
Figure CO2 shows wellbeing in New Zealand relative to the OECD against 23 indicators. The circle represents the OECD median score for each indicator, and the spokes represent outcomes in New Zealand relative to the OECD median. The irregular shape outside of the median circle represents outcomes for the 75th percentile. Where a spoke falls below the circle, New Zealand is in the bottom half of the OECD. Where the spoke falls outside of the circle, outcomes in New Zealand are better than the OECD median. Where a spoke falls past the irregular shape, New Zealand makes it to the top quarter of the OECD. SOME CAUTION IS REQUIRED WITH THIS DATA: International comparisons are frequently difficult to interpret because of differences between countries in methods used to collect, classify and record social data. We only show 23 of the 43 indicators used in The Social Report 2004 in the graph, because comparable international data is not available for each indicator. |
New Zealand makes it into the top half of the OECD for roughly two thirds of the 23 indicators for which internationally comparable data is available.
New Zealand performs well in the area of civil and political rights. We consistently have one of the lowest levels of perceived corruption across the OECD, and are in the top half of the OECD both for the percentage of women in parliament, and for voter turnout.
New Zealand also performs strongly for both our relatively high employment rates and relatively low unemployment rates. New Zealand's performance has improved markedly in this area since the early 1990s.
New Zealand appears to sit around the middle of the OECD for our performance in the area of health. Life expectancy in New Zealand is similar to the median life expectancy in the OECD, though there is a relatively narrow range of outcomes across the OECD for this indicator. Our position declined over the 1970s and 1980s but improved in the 1990s. We perform well for the prevalence of cigarette smoking but have relatively high suicide rates. We are the sixth worst performer for obesity rates.
In the area of knowledge and skills, New Zealand is at or near the OECD median for adult literacy, for participation rates in tertiary education for the 20-29 year age group, and for the proportion of adults with tertiary qualifications. None of the measures used in this report enable us to look at the relative performance of children and young people. However results from the OECD's PISA study, which is designed to look at trends in student achievement across time in 32 countries, ranked New Zealand 15 year-olds near the top for their overall performance.93 However, compared to other countries, New Zealand has greater differences between the best and poorest achieving students - a pattern also reflected in other international studies of school students.
New Zealand sits below the middle ranked OECD country for Gross Domestic Product (GDP) per capita. We also do poorly for income inequality. However, we are slightly better than the OECD median in relation to the proportion of the population on low incomes.
We do not have enough comparable international data in the safety domain to make any strong conclusions. However, there is some evidence to suggest that New Zealand has relatively high rates of child maltreatment deaths, though there is some concern about the comparability of such data across countries.
Lastly, New Zealanders rate themselves highly in terms of life satisfaction and overall happiness. Out of 25 OECD countries, New Zealand has the fifth highest percentage of the population who are satisfied with their lives.
