Relevance
Abuse or violence damages a child's physical and psychological health, with the consequences often experienced well into adolescence and adulthood.
Current Level And Trends
In the year to June 2003, there were 31,781 care and protection notifications to Child, Youth and Family (CYF). On a population basis, this represented 31.8 notifications per 1,000 children aged 0-16 years. Annual fluctuations in these figures do not necessarily reflect changes in the prevalence of child abuse. They may be influenced by the level of resources made available, and by changes in administration and reporting patterns. 80 More than one notification can be made for individual children.
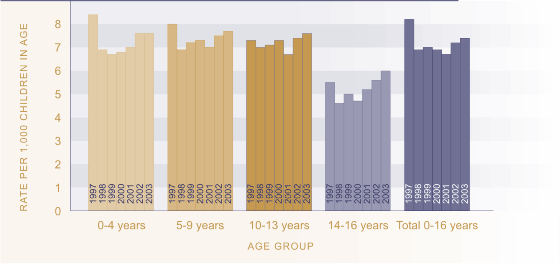
In the year to June 2003, 7,361 children were assessed as abused or neglected by CYF. This was a substantiated child abuse rate of 7.4 children for every 1,000 children 0-16 years of age, similar to the (revised) rate of 7.2 percent in 2002. 81
Figure SS1.1 Substantiated child abuse
and neglect rate, by age group, 1997-2003

Source: Ministry of Social
Development, SWIS (1997-2000), CYRAS (2001-2003)
Note: The rate is based on individual children who were assessed as
abused (physically, emotionally, sexually) or neglected. 2002 rates
have been revised.
Age And Sex Differences
There is little difference by sex in rates of abuse among children under 10 years old but at age 14-16 females are much more likely to be abused than males. In 2003, the rate of substantiated child abuse among 14-16-year-old females was 8.0 per 1,000, over twice the rate for males (3.9 per 1,000). These age and sex differences have been consistent over the last six years.
Table SS1.1 Substantiated cases of child abuse or neglect, by age and sex, years ended 30 June 2002 and 2003
| Age group |
Rate per 1,000 children |
|||||
|---|---|---|---|---|---|---|
|
2002 |
2003 |
|||||
|
Male |
Female |
Total |
Male |
Female |
Total |
|
| 0-4 years |
7.5 |
7.3 |
7.6 |
7.2 |
7.5 |
7.6 |
| 5-9 years |
7.3 |
7.6 |
7.5 |
7.4 |
7.9 |
7.7 |
| 10-13 years |
6.4 |
8.3 |
7.4 |
6.6 |
8.4 |
7.6 |
| 14-16 years |
3.7 |
7.4 |
5.6 |
3.9 |
8.0 |
6.0 |
| Total |
6.5 |
7.7 |
7.2 |
6.5 |
8.0 |
7.4 |
Source: Ministry of Social Development, CYRAS. Revised data for 2002
Ethnic Differences
Māori children are more likely than non-Māori children to be assessed as abused or neglected. In 2003, the rate per 1,000 was 11.9 for Māori and 5.9 for non-Māori. While the corresponding rates are not available for Pacific children, they are not over-represented among children assessed as abused, accounting for 11 percent of such children in 2003, about the same representation as they have in the child population.
Table SS1.2 Substantiated cases of child abuse or neglect, Māori and non-Māori ethnicity and sex, years ended 30 June, 1998-2003
|
Rate per 1,000 children
0-16 |
||||||
|---|---|---|---|---|---|---|
| Year to 30 June |
Māori |
Non-Māori |
||||
|
Male |
Female |
Total |
Male |
Female |
Total |
|
| 1998 |
11.8 |
13.9 |
13.0 |
4.6 |
5.5 |
5.1 |
| 1999 |
12.3 |
14.3 |
13.4 |
4.5 |
5.5 |
5.0 |
| 2000 |
11.1 |
13.2 |
12.3 |
4.7 |
5.6 |
5.3 |
| 2001 |
9.4 |
10.9 |
10.2 |
4.9 |
6.1 |
5.6 |
| 2002 |
9.7 |
11.4 |
11.8 |
5.5 |
6.5 |
5.7 |
| 2003 |
10.8 |
12.5 |
11.9 |
5.1 |
6.5 |
5.9 |
Source: Ministry of Social
Development, CYRAS
Note: 2001 and 2002 rates have been revised
International Comparison
A UNICEF report on child maltreatment deaths in 27 OECD countries, averaged over a five-year period during the 1990s, placed New Zealand twenty-fourth out of 27 countries, with a rate of 1.2 deaths per 100,000 children under the age of 15 years.82 This was high compared to an OECD median of 0.6 deaths per 100,000.
Only Mexico and the United States (both 2.2 per 100,000) had higher child maltreatment death rates than New Zealand. Outcomes for other countries include Australia and Canada (both 0.7 per 100,000, 18th equal), and the United Kingdom (0.4 per 100,000, 6th equal). These findings should be treated with caution because the very small numbers involved produce highly volatile rates. In addition, although the data comes from the same World Health Organization database and uses the same international classification of death by cause, there may be differences between countries, and within countries over time, in the classification of death by intention.
