Rationale
Feeling safe is fundamental to wellbeing. Anxiety and worries about victimisation detract from wellbeing in themselves, and may cause people to alter their behaviour to avoid being victimised. This limits people's options and can reduce their freedom. People's subjective perceptions about safety are not always linked to the actual risk of becoming a crime victim.
Current Level
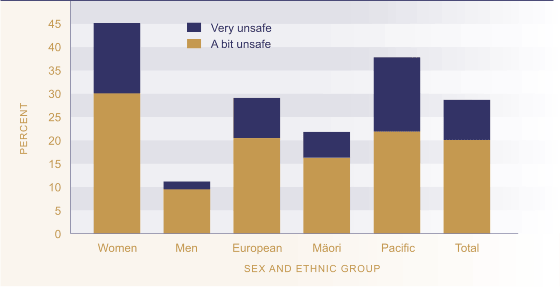
In 2001, 29 percent of New Zealanders reported feeling unsafe walking alone in their neighbourhood at night. A fifth (20 percent) reported feeling only 'a bit unsafe', while nine percent felt 'very unsafe'.
Figure SS3.1 Proportion of the population
who felt unsafe walking alone in their neighbourhood after dark, 2001

Source: Morris et al (2003)
People's perceptions varied widely according to their behaviour. Of people who reported they did not walk alone at night, 30 percent reported feeling it would be a bit unsafe and 16 percent said they felt walking alone was very unsafe. People who reported that they walked alone at night were much less likely to feel unsafe. Only ten percent felt a bit unsafe and one percent felt very unsafe.
Sex And Age Differences
Women were considerably more likely than men to report feeling unsafe about walking alone after dark (45 percent for females and 11 percent for males). Women were over three times more likely than men to report feeling a bit unsafe and over eight times as likely to report feeling very unsafe.
Table SS3.1 Proportion of adults aged 15 and over who felt unsafe walking alone in their neighbourhood after dark by sex, 2001
| Age Group | Sex | ||||||
|---|---|---|---|---|---|---|---|
| 15-16 | 17-24 | 25-39 | 40-59 | 60+ | Male | Female | |
| A bit unsafe | 17.7 | 19.6 | 22 | 18 | 21.5 | 9.5 | 30.1 |
| Very unsafe | 8.8 | 7.3 | 8 | 7.2 | 12.4 | 1.7 | 15.1 |
| A bit unsafe or very unsafe | 26.5 | 26.9 | 30 | 25.2 | 33.9 | 11.1 | 45.2 |
Source: Morris et al (2003)
There is relatively little age difference in perceptions of safety. Just over a third (34 percent) of those aged 60 and older said they felt it would be unsafe to walk alone in their neighbourhood after dark. This compares with 27 percent of people aged between 15 and 24. At all ages, women felt less safe than men.
Ethnic Differences
Pacific people were much more likely than other ethnic groups to report feeling unsafe about walking alone in their neighbourhood after dark. Over a third (38 percent) of Pacific people said they would feel unsafe, compared to 29 percent of the European and Other ethnic groups. The difference is greatest with regard to the proportion of people who felt very unsafe. Māori, by way of contrast, generally felt safer than other ethnic groups. Just over one-fifth (22 percent) of Māori said they would feel unsafe walking alone after dark in their neighbourhood, while 6 percent stated they would feel very unsafe.
Women were more likely to report feeling unsafe walking alone in their neighbourhood after dark than males for all ethnic groups. Pacific men were more than twice as likely as European and Māori men to report feeling unsafe. In contrast, a similar proportion of Pacific and European women reported they felt unsafe, while the proportion among Māori women was much lower. Pacific women, however, were considerably more likely to report feeling 'very unsafe' compared to other groups.
Table SS3.2 Proportion of adults aged 15 and over who felt unsafe walking alone in their neighbourhood after dark by ethnicity, 2001
| European | Māori | Pacific People | Other | |
|---|---|---|---|---|
| A bit unsafe | ||||
| Male |
9.1 |
7.9 |
16.5 |
12.3 |
| Female |
31.2 |
24.2 |
27 |
33.5 |
| Total |
20.5 |
16.3 |
21.9 |
22.8 |
| Very unsafe | ||||
| Male |
1.7 |
1.2 |
5.1 |
0.4 |
| Female |
15.2 |
9.7 |
26 |
13.1 |
| Total |
8.6 |
5.5 |
15.9 |
6.7 |
| A bit unsafe or very unsafe | ||||
| Male |
10.8 |
9.1 |
21.6 |
12.7 |
| Female |
46.4 |
33.9 |
53 |
46.6 |
| Total |
29.1 |
21.8 |
37.8 |
29.5 |
Source: Morris et al (2003)
