Relevance
The criminal victimisation rate provides a broad measure of personal safety and wellbeing. Surveys of criminal victimisation generally provide a more comprehensive picture of victimisation than police data, as not all offending is reported or recorded.
Current Level And Trends
Survey data shows that 30 percent of New Zealand adults aged 15 and over experienced victimisation during 2000. This is similar to the level in 1995 (31 percent).
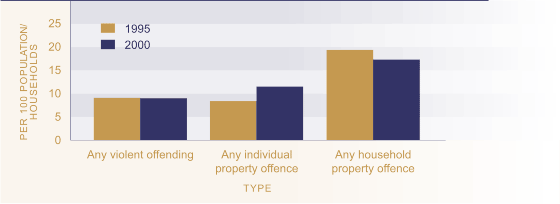
A breakdown by the type of offence shows that nine percent of the adult population reported they had been the victim of violent offending in 2000, the same level as in 1995. Eleven percent reported they had been subject to an individual property offence, such as theft or wilful damage, up from 8 percent in 1995. The proportion of people who were the victim of a household property offence was 19 percent in 1995 and 17 percent in 2000.
A small number of individuals accounted for the vast majority of violent victimisations. Less than 2 percent of the adult population were victims of violence five or more times, but they experienced 55 percent of the violent victimisations. Violent victimisations comprised slightly less than half of the total volume of victimisations disclosed by the 2001 survey.
Figure SS2.1 Criminal victimisation
prevalence rate by type of victimisation, 1995, 2000

Source: Morris et al (2003),
Tables 2.6, 2.8 and revised 1995 figures
Age Differences
Young adults are more likely than older adults to be a victim of crime. In the 2001 survey, 46 percent of the 15-24 year age group had experienced victimisation compared with 33 percent of those aged 25-39, 28 percent of the 40-59 year age group and 13 percent of those aged 60 and over. Youth were more than twice as likely to be a victim of violent crime as the 25-39 year age group, the next closest group. Younger adults were also more likely than older people to experience an individual property offence, though the difference by age was less pronounced than for violent offences.
Table SS2.1 Criminal victimisation rate by major offence type and age, 2000
| Offence type | Rate per 100 persons in each age group | ||||
|---|---|---|---|---|---|
| 15-24 | 25-39 | 40-59 | 60+ | Total | |
| Any violent offending (including sexual assault) |
23.5 | 9.5 | 5.6 | 1.3 | 9.0 |
| Any 'individual' property offence | 18.3 | 13.2 | 10.3 | 5.0 | 11.5 |
| Any victimisation (including household victimisation) |
45.9 | 32.9 | 28.2 | 12.7 | 29.5 |
Source: Morris et al (2003), Tables 2.6, 2.8, 2.13 and additional data
Sex Differences
The overall rate of victimisation did not vary by sex, with 30 percent of women and 29 percent of men reporting they had experienced victimisation in 2000. This is similar to 1995 when 31 percent of women and 32 percent of men experienced victimisation. While men and women were equally as likely to report being the victim of violence, more men than women disclosed violence by someone not well known to them (12 percent compared with 8 percent).
Survey information on partner violence shows that more than one in four women (26 percent) and just under one-fifth of men (18 percent) had been abused or threatened with violence by a partner at some time in their adult life. Changes in methodology between the 2001 and 1996 surveys on criminal victimisation mean it is not possible to compare changes in partner victimisation over time. 83 Women's lifetime experience of sexual interference or assault was considerably higher than men's (19 percent compared with 5 percent).
Ethnic Differences
In 2000, Māori were considerably more likely to be a victim of crime (41 percent) than Pacific people (28 percent) and Europeans (29 percent). The difference was greatest for violent victimisation, with one-fifth of Māori experiencing offending of this type, compared to 11 percent of Pacific people and 8 percent of Europeans. Māori were also more likely to experience individual property offences, though the difference was less marked than for violent offending. Pacific peoples were the least likely of any group to experience offending of this type. The proportion of Māori women who had been abused or threatened with violence by a partner at some time during their adult life was very much higher (49 percent) than for European women (24 percent) and Pacific women (23 percent).
Table SS2.2 Criminal victimisation rate by major offence type and ethnicity, 2000
| Offence type | Rate per 100 persons aged 15+ | |||
|---|---|---|---|---|
| European | Māori | Pacific | Other | |
| Any violent offending (including sexual assault) |
8.4 | 19.5 | 11.3 | 2.6 |
| Any 'individual' property offence | 11.5 | 14.7 | 8.2 | 11.9 |
| Any victimisation (including household victimisation) |
28.9 | 40.9 | 28.3 | 26.4 |
Source: Morris et al (2003), Table 2.14
