Employment
Definition
The proportion of the population aged 15–64 years who are in paid employment
for at least one hour per week.
Relevance
The employment rate is the best available
indicator of the prevalence of paid employment. It is affected by trends
in both unemployment and labour force participation (the proportion of the
working-age
population either employed or unemployed).
Current level and trends
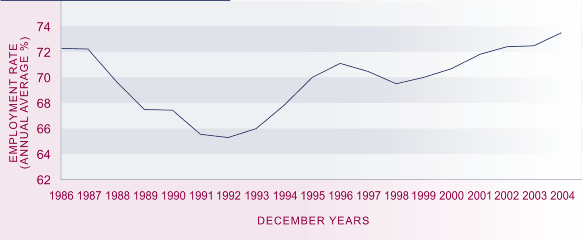
In 2004, 73.5 percent of 15–64 year olds (1.966
million people) were employed for one hour or more per week. This was slightly
above the rate recorded in 1986 (72.3 percent). The employment rate has been
rising since 1992, except during the economic downturn in 1997 and 1998. The
increase from 65.4 percent in 1992 to 73.5 percent in 2004 corresponds to a
rise of 462,400 in the number of employed people aged 15–64. Over the same
period, the number of people aged 15–64 increased by 374,400.
Full-time employment rates declined between 1986 (60.4 percent) and 1992
(51.5 percent) and have yet to recover to 1986 levels for men. Part-time employment
rates have increased for both sexes over the period (from 11.9 percent in 1986
to 15.8 percent in 2004), almost doubling for men. However, women (23.3 percent)
continue to have higher part-time employment rates than men (8.1 percent).
Figure PW2.1 Employment rate, 1986–2004

Source: Statistics New Zealand, Household Labour Force Survey (1986–2004)
Note: Based on population aged 15–64
Age and sex differences
The employment rate decline between 1987
and 1992 affected all age groups but was most pronounced for young people aged 15–24.
Youth employment rates have remained relatively low during the period of employment
growth since 1992, possibly due to a growth in participation in tertiary education
and training. Conversely, employment rates for people aged 45–64 have grown
strongly since 1992, driven mainly by the phasing in of the higher age of eligibility
for New Zealand Superannuation, rising employment among women, and an increase
in the demand for labour.
Women’s employment rate is significantly lower than that for men, owing
mainly to the fact that women spend more time on childcare and other unpaid
household work, and are more likely than men to be undertaking some form of
study or training. The gap has, however, narrowed substantially since the mid-1980s,
from 24 to 14 percentage points.
Table PW2.1 Employment rates (%), by age and sex, selected years,
1986–2004
| Year |
15–24 |
25–44 |
45–64 |
65+ |
Males 15–64 |
Females 15–64 |
Total 15–64 |
| 1986 |
68.7 |
79.3 |
64.8 |
8.8 |
84.6 |
60.2 |
72.3 |
| 1991 |
55.0 |
74.0 |
61.5 |
6.0 |
74.0 |
57.5 |
65.7 |
| 1996 |
59.5 |
77.3 |
70.2 |
6.6 |
79.0 |
63.4 |
71.1 |
| 2001 |
55.8 |
77.9 |
73.5 |
8.6 |
79.1 |
64.8 |
71.8 |
| 2004 |
56.8 |
79.3 |
76.8 |
11.1 |
80.8 |
66.5 |
73.5 |
Source: Statistics New Zealand, Household Labour Force Survey (1986-2004)
Note: Average for December years
Ethnic differences
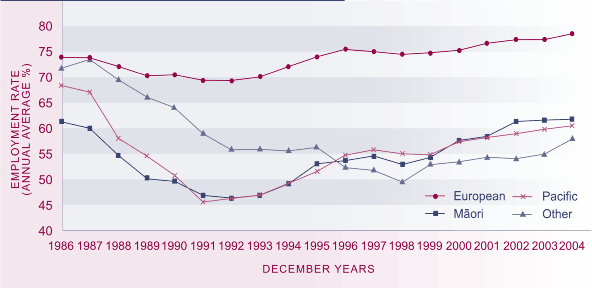
The proportions of the European, Māori and Pacific
peoples working-age populations in employment all fell between 1987 and 1992
and have risen since then. The only ethnic group to have higher employment
rates in 2004 than in the mid-1980s was the European group (78.4 percent
employed in 2004, compared with 73.8 percent in 1986). The Māori employment
rate, at
61.7 percent in 2004, had recovered to 1986 levels (61.2 percent), but Pacific
peoples were still much less likely to be employed (68.4 percent in 1986,
60.5 percent in 2004). The employment rate for the "Other" ethnic category
has fallen
from being the second highest in the late-1980s to the lowest since the mid-1990s.
Figure PW2.2 Employment rate, by ethnic group, 1986–2004

Source: Statistics New Zealand, Household Labour Force Survey (1986–2004)
Notes: [1] Based on population aged 15–64 [2] "Other" includes Asian
Regional differences
In 2004, employment rates were highest
in Southland (78.0 percent) and Canterbury (77.7 percent) and lowest in Northland (69.2
percent) and Manawatu-Whanganui (70.6 percent).
International comparison
In 2003, the New Zealand employment rate of 72.5 percent for people aged 15–64 years was well above the
OECD average of 65.0 percent and ranked seventh highest out of 28 OECD
countries. New Zealand's position has improved from 13th place in 1990, almost entirely due to the
recovery in male employment rates. Switzerland had the highest employment rate in 2003 (77.8 percent). The New Zealand rate in 2003 was similar to those of the United Kingdom (72.9 percent) and Canada (72.1 percent) and higher than those of the United States (71.2 percent) and Australia (69.3 percent). Of those countries, the United States and Australia had lower female employment rates than New Zealand in 2003.51
|


