Unemployment
Definition
The official unemployment rate is the number of people aged 15 and over
who are not employed and who are actively seeking and available for paid work,
expressed as a percentage of the total labour force. The labour force is defined
as the population aged 15 and over who are either employed or unemployed (not
employed but actively seeking and available for paid work).
Relevance
This is a key indicator of labour market
outcomes and the lack of access to employment. The unemployment rate is an
important reflection of overall economic conditions and may give some sense
of the ease with which people are able to move into employment.
Current level and trends
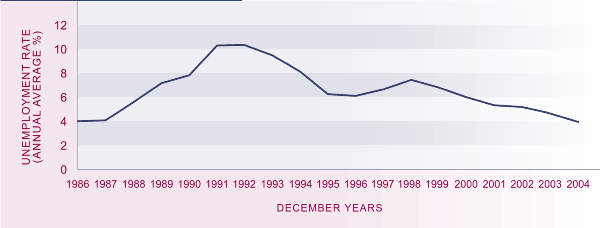
In 2004, 3.9 percent of the labour force (or
82,000 people) were unemployed and actively seeking work. The unemployment
rate has declined steadily since 1998 and is considerably lower than the peak
rate
of 10.4 percent in 1992 (176,000 people unemployed). The 2004 unemployment
rate was just under the rate of 4.1 percent in 1986 when records began (70,000
people unemployed).
In 2004, 23 percent of the surveyed unemployed who specified their duration
of unemployment had been unemployed for a continuous period of six months or
more, a decline from 27 percent in 2003. The 2004 level of long-term unemployment
was the same as that recorded in 1986 and substantially lower than the peak
of 53 percent in 1992.
Figure PW1.1 Unemployment rate, 1986–2004

Source: Statistics New Zealand,
Household Labour Force Survey (1986–2004)
Ethnic differences
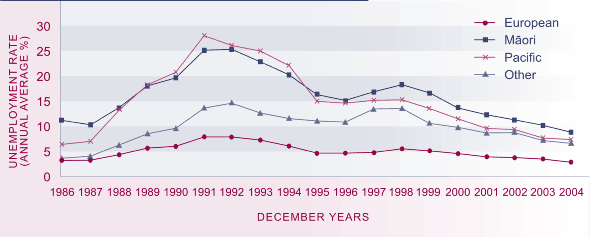
Substantial differences in unemployment rates persist
for different ethnic groups. Māori unemployment rose from 11.3 percent in
1986 to a peak of 25.4 percent in 1992 but had fallen to 8.8 percent by 2004,
the
lowest rate recorded since the Household Labour Force Survey began. Between
1986 and 1991, the unemployment rate for Pacific peoples rose from 6.6 percent
to 28.0 percent, the highest rate for any ethnic group. Pacific peoples’
unemployment rate has declined more than that of Māori since the mid-1990s
and was 7.4 percent
in 2004. Pacific unemployment is still higher than it was in 1986.
The unemployment rate is lowest among people of European ethnicity. Their
unemployment rate rose from 3.3 percent in 1986 to a peak of 7.9 percent in
1992 and had declined to 2.8 percent by 2004. The unemployment rate of the
"Other" ethnic group category (which comprises predominantly people of Asian
ethnicity and includes many recent migrants) increased from 3.7 percent in
1986 to 14.8 percent in 1992, and was still relatively high at 6.6 percent
in 2004.
Figure PW1.2 Unemployment rate, by ethnic group, 1986–2004

Source: Statistics New Zealand, Household Labour Force Survey (1986–2004)
Note: "Other" includes Asian
Age and sex differences
Unemployment rates among different age
groups have followed similar trends but the level among those aged 15–24 (9.3 percent in
2004) has been consistently more than twice the rate for older groups. This
group comprised 42 percent of all unemployed in 2004. Unemployment rates were
higher for males than females in the peak years of unemployment. However, the
pattern has reversed in recent years, with females having slightly higher unemployment
rates than males.
Table PW1.1 Unemployment rates (%), by age and sex, selected years,
1986–2004
| Year |
15–24 |
25–44 |
45–64 |
Total 15+ |
Males |
Females |
| 1986 |
7.9 |
3.1 |
1.8 |
4.1 |
3.6 |
4.8 |
| 1991 |
18.8 |
8.8 |
6.1 |
10.3 |
10.9 |
9.6 |
| 1996 |
11.8 |
5.2 |
3.9 |
6.1 |
6.1 |
6.1 |
| 2001 |
11.8 |
4.5 |
3.4 |
5.3 |
5.3 |
5.3 |
| 2004 |
9.3 |
3.2 |
2.3 |
3.9 |
3.5 |
4.4 |
Source: Statistics New Zealand, Household Labour Force Survey (1986–2004)
Note: Average for December years
Regional differences
In 2004, regional unemployment rates
were highest in Bay of Plenty and Gisborne-Hawke’s Bay (each 4.8 percent) and Northland
(4.5 percent) and lowest in Tasman-Nelson-Marlborough-West Coast (2.5 percent). The fall in the unemployment rate between 1992 and 2004 was greatest
in the Northland region. Regional unemployment rates are closer now than they
have ever been since the survey began in 1986. In 2004 the spread from the
highest to the lowest unemployment rate was 2.3 percentage points, compared
with a spread of 4.5 percentage points a year earlier. The difference in unemployment
rates among the regions was greatest in 1994 (6.9 percentage points).
International comparison
In 2004, New Zealand ranked second out of 27 OECD countries with a standardised unemployment rate
of 3.9 percent, compared with the OECD average of 6.9 percent. Since
the mid-1980s, New Zealand's unemployment
rate relative to other OECD countries has ranged from one of the lowest (ranked
fifth in 1986 with a rate of 4.1 percent) to one of the highest (ranked 17th
in 1992 with a rate of 10.3 percent) to a more favourable position in recent
years. South Korea had the lowest unemployment rate in 2004 (3.7 percent). The New Zealand unemployment rate in 2004 was lower than those of the United Kingdom (4.6 percent), Japan (4.7 percent), the United States (5.5 percent), Australia (5.5 percent) and Canada (7.2 percent).49 In 2003, New Zealand ranked sixth best in terms of the proportion of the unemployed who had been
unemployed for six months or longer.50
|


