Workplace injury claims
Definition
The number of workplace accident insurance claims reported to the Accident
Compensation Corporation (ACC) per 1,000 full-time equivalent employees, excluding
those employees who received accident and emergency treatment only.
Relevance
Safety at work is an important contributor
to wellbeing and the risk of work-related accidents or illness can be seen
as one component of the quality of work. The best currently available measure
of the incidence of workplace injuries comes from the database of claims
made to the ACC.
Current level and trends
Provisional data for the 2003 calendar year
shows that 247,500 work-related injury claims had been reported to the ACC by 31
March 2004, an increase of 10,500 (4 percent) on the year ended December 2002 with a similar
reporting cut-off. This represents a rate of 146 claims per 1,000 full-time
equivalent employees (FTEs), about the same as the previous year (a rate
of 143 per 1,000 FTEs). The majority of claims were for medical treatment
only (ie not including weekly compensation). Eighty-two percent of claims
were in respect of employees, and people who employed others in their own
business. The remainder were the self-employed who did not employ others
in their business. The incidence rate for the self-employed not employing
others was almost twice that of the rest of the workforce, as defined above
(233 per 1,000 FTEs compared with 134 per 1,000 FTEs).
Information on workplace injuries for 2003 is produced by Statistics New Zealand and output was based, for the first time, on a calendar year rather
than a financial year. These figures have been backdated to 2001 but are not
directly comparable with previous figures on workplace injuries.
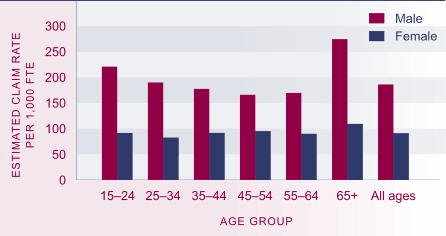
Figure PW4.1 Estimated claim rate per 1,000 FTE employed, by age and
sex, 2003

Source: Statistics New Zealand (2004d)
Injury claims for the year ending December 2003, that had been reported
by March 2004, included 87 work-related fatalities. This is likely to be an
underestimate of the final number of fatalities, because some deaths may have
occurred subsequently from injuries in that period, and not all fatal work-related
accidents result in a claim to ACC. Construction accounted for 23 percent of
work-related fatalities, followed by agriculture (13 percent) and manufacturing
(11 percent).
Age and sex differences
Males are more than twice as likely as
females to suffer workplace injuries involving a claim to ACC (186 per 1,000 FTEs for males
compared with 91 per 1,000 FTEs for females). This reflects in part a male
predominance in relatively dangerous occupations. Among males, the highest
injury claim rate was for those aged 65 and over followed by those aged under
25. Among females, age differences in the injury claim rate were less pronounced.
Ethnic differences
Workplace injury claim rates are higher for Māori
(190 per 1,000 FTEs) than for other ethnic groups. This is likely to reflect
the fact that Māori are disproportionately employed in industries and occupations that have high
injury rates, such as forestry. In 2003, the next highest rate was that for
Pacific peoples (157 per 1,000 FTEs), followed by Europeans (134 per 1,000
FTEs). The "Other" (including Asian) ethnic group has the lowest accident claim
rate (112 per 1,000 FTEs).
Table PW4.1 New workplace injury claims, by ethnicity, 2003
| Ethnic group |
Number of claims |
Rate per 1,000 FTEs |
| European |
177,700 |
134 |
| Māori |
31,200 |
190 |
| Pacific |
12,300 |
157 |
| Other (including Asian) |
13,900 |
112 |
| Total |
247,500 |
146 |
Source: Statistics New Zealand (2004b)
Regional differences
The highest incidence rates occurred
in Gisborne-Hawke’s Bay and Northland, with rates of 203 and 202 claims per 1,000 FTEs,
respectively. Wellington had the lowest rate of 82 claims per 1,000 FTEs. These figures reflect the main
occupations in these regions.
Industry differences
The variation in injury rates for different
industries underlies many of the differences in injury rates for males and females, and ethnic
and age groups. The highest injury rates are in hunting and fishing (257 per
1,000 FTEs), mining (235 per 1,000 FTEs), agriculture (197 per 1,000 FTEs)
and manufacturing (196 per 1,000 FTEs).
Table PW4.2 New workplace injury claims, by industry, 2003
| Industry |
Number of claims |
Rate per 1,000 FTEs |
| Hunting and fishing |
1,000 |
257 |
| Mining |
1,000 |
235 |
| Agriculture |
24,200 |
197 |
| Manufacturing |
52,100 |
196 |
| Construction |
23,700 |
181 |
| Forestry |
1,800 |
176 |
| Electricity, gas and water supply |
1,100 |
136 |
| Transport and storage |
9,300 |
126 |
| Communication services |
2,700 |
94 |
| Wholesale and retail trade |
27,400 |
92 |
| Health and community services |
10,700 |
75 |
| Property and business services |
12,400 |
71 |
| Education |
7,700 |
61 |
| Accommodation, cafes and restaurants |
4,500 |
60 |
| Finance and insurance |
1,600 |
32 |
Source: Statistics New Zealand (2004d)
|

