Appendix 3: Technical notes
People
Data sources: Clark et al (2013), Youth’12 Overview: The Health and Wellbeing of New Zealand Secondary School Students in 2012; OECD (2014), Society at a Glance (2014): OECD Social Indicators; Statistics New Zealand (2015), Historical Population Estimates Tables; Statistics New Zealand (2015), Births and Deaths: Year Ended December 2014; Statistics New Zealand (2015), National Ethnic Population Projections: 2013(base)-2038; Statistics New Zealand (2015), Population Indicators; Statistics New Zealand (2015), Subnational Family and Household Projections: 2013(base)-2038; Statistics New Zealand (2014), 2013 Census Quick Stats about Culture and Identity; Statistics New Zealand (2014), 2013 Census Quick Stats about Families and Households; Statistics New Zealand (2014), 2013 Census Quick Stats about Housing; Statistics New Zealand (2014), 2013 Census Quick Stats about National Highlights; Statistics New Zealand (2014), Disability Survey: 2013; Statistics New Zealand (2014), National Population Estimates: At 30 June 2014; Statistics New Zealand (2014), National Population Projections: 2014(base)-2068; Statistics New Zealand (2013), 2013 Census Usually Resident Population Counts; Statistics New Zealand (2012), Parents Supporting Children Who Do Not Live with Them; Statistics New Zealand (2012), Population Mythbusters: More Women are Remaining Childless; Statistics New Zealand (n.d.), Population Mobility of Urban/Rural Profile Areas.
HealthTop
H1 Life expectancy at birth
Definition/formulae: The average length of life remaining at birth, assuming people experience the age-specific death rates of a given period from birth onwards, as calculated by Statistics New Zealand. For example, life expectancy at birth for the period 2012-2014 is based on death rates of that period, and takes no account of changes in death rates after that period.
Analysis of deprivation is based on NZDep2013 which combines census data relating to income, home ownership, employment, qualifications, family structure, housing, and access to transport and communication to produce a score for each meshblock in New Zealand. These scores are grouped into 10 categories (deciles), where 1 represents the areas with the least deprived scores and 10 the area with the most deprived scores.
European or Other (including New Zealander) includes people who belong to the “European” or “Other” ethnicity groups. People who belong to both groups are counted only once. Almost all people in the “Other” ethnicity group belong to the New Zealander sub-group.
Limitations of data: Available annually for the total population. Pacific, European/Other and Asian ethnic group data is available only for 2005–2007 and 2012–2014.
Data sources: Statistics New Zealand (2015), New Zealand Period Life Tables: 2012–14; Statistics New Zealand, New Zealand Social Indicators website; Statistics New Zealand (2015), Subnational Period Life Tables: 2012–14.
H2 Health expectancy
Definition/formulae: The average number of years it is expected people will live independently, with no functional limitation needing assistance, as calculated by the Ministry of Health.
The figures were estimated by Sullivan's method (a method for computing health expectancies) using life tables supplied by Statistics New Zealand and disability rates from the 2013 post-census Disability Survey.
Non-Māori are defined as those respondents who identified with an ethnic group other than Māori.
Limitations of data: The information on functional limitations comes from respondents' self-reports, which are influenced by norms and expectations that differ between cultural groups and over time. An arbitrary threshold is put on disability, and so it overlooks all disability that does not meet the threshold of a functional limitation requiring some level of assistance. It also treats all disability above the threshold as the same. The ability to monitor health expectancy on a regular basis depends on the availability of mortality and disability data (the latter from the post-census Disability Survey). Both variables are required by narrow age groups (at least 10-year age groups), sex and ethnicity, and the disability prevalence data is required by support need level. Hence both mortality and disability data is subject to smoothing before it can be used in the Sullivan spreadsheet. Comparability of the disability data over time cannot be guaranteed, even though efforts are made to ensure the comparability of the Disability Survey from wave to wave.
The 2013 Disability Survey included a small over-sample for Māori only, compared with considerable oversampling of Māori and Pacific peoples which occurred in the 2006 Disability Survey. Therefore the health expectancy estimates for Māori for 2013 are less reliable given the wide confidence intervals. The survey design for the Disability Survey has changed over time. In particular, the findings of the 2006 Disability Survey may be less comparable and should be interpreted cautiously.
Data source: Ministry of Health (2015), Independent Life Expectancy in New Zealand 2013.
H3 Suicide
Definition/formulae: The number of suicide deaths per 100,000 population, age-standardised to the World Health Organization (WHO) standard population.
Limitations of data: Because suicide is a relatively rare event in statistical terms, rates of suicide death can vary markedly from year to year. Any interpretation of trends requires an examination of rates over several years. Deaths by suicide are subject to a coroner’s inquiry and can only be officially deemed suicide once an inquest is complete. This means there can be a considerable delay in the publication of the final statistics. Where populations are small, the suicide death rate can be greatly inflated by one or two deaths.
Data on intentional self-harm hospitalisations provides an incomplete picture of self-harm events. The data is available only for those admitted to hospital as inpatients or day patients for self-inflicted injury. Those cared for in hospital but not admitted and those cared for by primary or community care services are not reported. Also excluded are people re-admitted for intentional self-harm within two days of a previous such admission (Ministry of Health, 2015, p3). As the motivation for intentional self-harm varies, hospitalisation data is not a measure of suicide attempts (Ministry of Health, 2015, p36).
Comparability over time is affected by a change in the population concept in 1991 (from de facto to resident). Because of a change in the ethnicity classification in September 1995 (from ancestry to self-reported), comparable data is available only from 1996 onwards. Ethnic-specific mortality data is subject to some uncertainty owing to the differences in collection across different providers. Ethnicspecific data in New Zealand is also subject to uncertainty because of the small numbers in non-European ethnic groups. The small numbers tend to distort the rates used to compare populations.
A comparison of international trends in suicide death is problematic owing to the different methods used to classify suicide. The New Zealand age-standardised rate in the international comparison data has been calculated in a manner consistent with the international figures available, and may differ slightly from the rates presented elsewhere (Ministry of Health, 2015, p34).
Data sources: Ministry of Health, Mortality Collection, National Minimum Dataset; Ministry of Health (2012), Suicide Facts: Deaths and Intentional Self-Harm Hospitalisations 2012; OECD (2014), OECD Factbook: Economic, Environmental and Social Science.
H4 Self-rated health
Definition/formulae: The proportion of the population aged 15 years and over who rated their health as at least good (including ratings of good, very good or excellent), as measured by the New Zealand Health Survey (NZHS). People were asked to rate their health on a 1–5 scale as either poor (1), fair (2), good (3), very good (4) or excellent (5).
This information is collected through the NZHS which is conducted by the Ministry of Health to provide timely, reliable and relevant health information. The surveys were conducted in 1992/1993, 1996/1997, 2002/2003 and 2006/2007. In addition, separate stand-alone surveys on specific subjects were conducted once every three or four years as part of the wider health survey programme. From July 2011, all the above surveys have been integrated into the single NZHS, which is now in continuous operation. The NZHS has a multi-stage, stratified, probability-proportional-to-size (PPS) sampling design. The survey is designed to yield an annual sample size of approximately 13,000 adults and 4,500 children.
Age-standardisation (standardised to the WHO World Standard population age distribution – Ahmad et al (2000)) allows for comparisons to be made by sex, ethnic group and neighbourhood deprivation, and between surveys. If crude (unadjusted) rates are required, refer to the relevant Ministry of Health survey publications.
Analysis of deprivation is based on NZDep2013 which measures the level of socio-economic deprivation for each neighbourhood (meshblock) according to a combination of 2013 Census variables. Survey data is presented for NZDep2013 quintiles 1–5, with quintile 1 representing the 20 percent with the lowest levels of deprivation (the least deprived areas) and quintile 5 representing the 20 percent with the highest level of deprivation (the most deprived areas).
Limitations of data: Survey estimates are subject to sampling error and small differences between groups may not be statistically significant.
The survey can be used to look at associations between different factors, such as health status and neighbourhood deprivation. However, it cannot be concluded that the survey results show cause-and-effect relationships between these factors, in part because it is not known which factor occurred first. For example, if the survey finds that a particular condition is more common in people living in deprived areas, an association has been identified. This association does not necessarily mean the condition is caused by living in deprived areas.
Self-reported health measures are based on an individual’s own perception of their health status and functioning. These measures provide an alternative source of data to objective measures of health. However, the survey results are likely to underestimate or overestimate some indicators owing to the nature of self-reported information. For example, people may over-report good behaviours or under-report risk behaviours based on what they consider to be socially desirable, or may not accurately recall previous events. The amount of error will vary by indicator, depending on a number of factors (including the age of the respondent).
International comparability is limited to a lack of measurement standardisation. The reference year for data in the Better Life Index 2015 is 2013 with the exception of 2012 for the United States; 2011 for Australia and the Russian federation; 2010 for Japan; 2009 for Chile; and 2006 for Mexico.
Data sources: Ministry of Health, New Zealand Health Survey 2013/2014, 2012/2013, 2011/2012, 2006/2007 customised data; OECD (2015), Better Life Index 2015 edition.
H5 Psychological distress
Definition/formulae: The proportion of the population aged 15 years and over who experienced psychological distress and had a high probability of having an anxiety or depressive disorder, as defined by the Kessler Psychological Distress Scale and measured by the New Zealand Health Survey (NZHS). The Kessler Psychological Distress Scale was developed to yield a global measure of psychosocial distress, and asks questions about levels of nervousness, agitation, psychological fatigue and depression in the past four weeks. People who score 12 or more on the Kessler Psychological Distress Scale have a high probability of having an anxiety or depressive disorder.
See “Self-rated health” indicator for information on the NZHS, age-standardisation and deprivation.
Limitations of data: See “Self-rated health” indicator for limitations.
Data sources: IHME (2015), GBD Compare; Ministry of Health (2015), New Zealand Health Survey 2013/2014, 2012/2013, 2011/2012, 2006/2007 customised data.
H6 Obesity
Definition/formulae: Obesity is defined as a body mass index (BMI) of 30 or more (or equivalent for those younger than 18 years), as measured by the New Zealand Health Survey (NZHS). BMI is a measure of weight adjusted for height, and is calculated by dividing weight in kilograms by height in metres squared (kg/m2). People had their height and weight measured by interviewers, rather than self-reported information being used. Therefore these results are more reliable than self-reported information.
See “Self-rated health” indicator for information on the NZHS, age-standardisation and deprivation.
Limitations of data: See “Self-rated health” indicator for limitations.
Data sources: IHME (2015), GBD Compare; Ministry of Health (2015), New Zealand Health Survey 2013/2014, 2012/2013, 2011/2012, 2006/2007 customised data; OECD (2014), OECD Factbook: Economic, Environmental and Social Science.
H7 Cigarette smoking
Definition/formulae: Current smokers are defined as the proportion of the population aged 15 years and over who had smoked more than 100 cigarettes in their lifetime and currently smoked at least once a month, as measured by the New Zealand Health Survey (NZHS).
Daily smokers are defined as the proportion of the population aged 15 years and over who had smoked more than 100 cigarettes in their lifetime and currently smoked at least once a day.
See “Self-rated health” indicator for information on the NZHS, age-standardisation and deprivation.
Limitations of data: See “Self-rated health” indicator for limitations.
Data sources: IHME (2015), GBD Compare; Ministry of Health (2015), New Zealand Health Survey 2013/2014, 2012/2013, 2011/2012, 2006/2007 customised data; OECD (2014), OECD Factbook: Economic, Environmental and Social Science.
H8 Potentially hazardous drinking
Definition/formulae: Potentially hazardous drinkers are defined as the proportion of the population aged 15 years and over who drank alcohol and who scored 8 or more on the Alcohol Use Disorders Identification Test (AUDIT), as measured by the New Zealand Health Survey (NZHS).
AUDIT is a 10-item questionnaire covering alcohol consumption, alcohol-related problems and abnormal drinking behaviour. It was developed by the World Health Organization (WHO) as a screening tool for health professionals to identify people at risk of developing alcohol problems. Each question is scored from 0 to 4, so the questionnaire has a maximum score of 40. Potentially hazardous drinking is defined as an established pattern of drinking that carries a high risk of future damage to physical or mental health, but has not yet resulted in significant adverse events. It is commonly identified from an AUDIT score of 8 or more.
See “Self-rated health” indicator for information on the NZHS, age-standardisation and deprivation.
Limitations of data: As men and women have been assigned the same cut-off score, potentially hazardous drinking in women may be underestimated as they generally have lower alcohol tolerance than men. See “Self-rated health” indicator for other limitations.
Data sources: IHME (2015), GBD Compare; Ministry of Health (2015), New Zealand Health Survey 2013/2014, 2012/2013, 2011/2012, 2006/2007 customised data; OECD, “Alcohol consumption”, Health: Key Tables (accessed July 2015).
H9 Participation in physical activity
Definition/formulae: The proportion of the population aged 15 years and over who met physical activity guidelines (ie doing at least 30 minutes of exercise on five or more days in the past week), as measured by the New Zealand Health Survey (NZHS).
See “Self-rated health” indicator for information on the NZHS, age-standardisation and deprivation.
Limitations of data: See “Self-rated health” indicator for limitations.
Data sources: IHME (2015), GBD Compare; Ministry of Health (2015), New Zealand Health Survey 2013/2014, 2012/2013, 2011/2012, 2006/2007 customised data.
Knowledge and skillsTop
K1 Participation in early childhood education
Definition/formulae: The level of participation and enrolments in early childhood education (ECE). The headline measure uses prior participation in ECE for children starting school. The second measure uses enrolment rates in ECE.
June results have been provided for both measures to ensure consistency across measures and time.
Rates calculated for enrolments use the most recent Statistics New Zealand population estimates and may differ slightly from rates published by the Ministry of Education.
Ethnicity is total response, where people who have been identified in more than one ethnic group have been counted in each ethnic group. For the New Zealand total, individuals are counted only once.
Limitations of data: In 2014, the method for data collection changed and around 40 percent of ECE services completed the annual census using the Ministry of Education's new electronic collection tool for ECE: ELI. For these services, the data shown relates to attendances in ECE licensed services, not enrolments. This is a change to the definition of the data and means that the data should not be compared with previous years.
Data sources: Ministry of Education, Education Counts website; OECD (2014), Education at a Glance 2014: OECD Indicators.
K2 School leavers with higher qualifications
Definition/formulae: The proportion of secondary school leavers who left school with a qualification at National Certificate of Educational Achievement (NCEA) Level 2 or above.
From 2009, NCEA Level 2 included the total number of school leavers who attained:
- NCEA Level 2 or another Level 2 National Qualifications Framework (NQF) qualification or:
- a non-NQF award at the equivalent of NCEA Level 2, including Accelerated Christian Education (ACE), International Baccalaureate (IB) or Cambridge International Exams (CIE), or another overseas award at Year 12
- National Certificate Level 3 (NCEA Level 3) or:
- a non-NQF award at the equivalent of NCEA level 3 including ACE, IB or CIE, or another overseas award at Year 13
- Scholarship or National Certificate at Level 4 or above.
Data is as at the end of the school leaver year.
Ethnicity is total response, where people who have been identified in more than one ethnic group have been counted in each ethnic group. For the New Zealand total, individuals are counted only once.
For this indicator, European refers to people who affiliate as New Zealand European, Other European or European (not further defined). For example, this includes, but is not limited to, people who consider themselves as Australian (excluding Australian Aborigines), British and Irish, American, Spanish and Ukrainian.
Limitations of data: Changes to the qualifications framework over time have made long-term comparisons more difficult. Data from 2009 to the present is most consistent.
Data sources: Ministry of Education, Education Counts website; Historic data sourced from previous Social Report publications.
K3 Participation in tertiary education
Definition/formulae: Participation in tertiary education is calculated by the number of students aged 15 years and over enrolled with a tertiary education provider (see below) in formal qualifications (or programmes of study) of greater than 0.03 equivalent full-time tertiary study at any time during the year. The data excludes all non-formal learning, on-the-job industry training, and private training establishments that did not receive tuition subsidies. Only domestic students are included.
Modern apprenticeship students and other industry trainees who are doing courses that fit into the above definition are included in the statistics (typically, doing block courses at a polytechnic). If their learning is totally on the job, they will not be included. Community education courses are excluded from the statistics.
Tertiary providers include universities, institutes of technology and polytechnics, wānanga, public providers, and private training establishments who provide a range of approved qualifications.
Age-standardised rates have been used in the current level and trends section, and the sex and ethnic group differences sections.
Students who were enrolled in more than one qualification level have been counted in each level. Consequently, the sum of the students in each level may not add to the total number of students.
Students who identify with more than one ethnic group have been counted in each group. Consequently, the sum of the students in each ethnic group may not add to the total number of students.
Limitations of data: Changes in the number of institutions, the status of institutions, and the types of courses offered affect comparisons over time.
Data sources: Ministry of Education, Education Counts website and customised data; OECD (2014), Education at a Glance 2014: OECD Indicators; Statistics New Zealand, New Zealand Income Survey.
K4 Educational attainment of the adult population
Definition/formulae: The proportion of adults aged 25-64 years with an educational attainment of (1) at least upper secondary school level, and (2) Bachelor’s degree or higher, as measured in the Household Labour Force Survey (HLFS). At least upper secondary school level includes any formal qualification at NCEA Level 2 (or equivalent) or higher. Bachelor’s degree or higher includes Bachelor’s degrees, postgraduate certificates or diplomas, Master’s degrees, and Doctorates.
For this report, at least upper secondary is set at NCEA L2 or equivalent, and above. This benchmark is higher than previously reported (NCEA Level 1 or equivalent), but reflects the direction international reporting is heading and the reducing value of an NCEA L1 qualification. Bachelor's degree and above is as described and has not changed.
Levels of education used for OECD results for at least upper secondary correspond to the International Standard Classification of Education (ISCED) levels 3A, 3B, 3C long programmes, and ISCED level 4 and above. Bachelor's and above corresponds to ISCED levels 5A; and 6.
Limitations of data: Data is based on a sample survey and is therefore subject to sampling error.
A major improvement in coding post-school qualifications in the HLFS occurred in the June 2013 quarter 2013 and may have resulted in some discontinuity in reporting. Categories prior to this date are reasonably comparable at this level, but caution should be exercised in any comparison. Qualifications have also changed over the period of the survey such as the introduction of NCEA in 2002. As a result, a best fit approach is used for time series data.
The HLFS is undergoing progressive revision and past data was rebased in 2015, adding to variations in past reporting beyond changes to definitions.
A major change in coding ethnicity in the HLFS occurred in the December 2007 quarter. From 2007, “total response” is used for ethnicity output; people who reported more than one ethnic group are counted once in each group reported. This means that the total number of responses for all ethnic groups can be greater than the total number of people who stated their ethnicities. Ethnic group data from earlier periods is concorded on a “best fit” basis and may not be directly comparable. People responding “New Zealander” from the December 2007 quarter are coded in European/Other.
Data sources: OECD (2015), Education at a Glance Interim Report: Update of Employment and Educational Attainment Indicators; Statistics New Zealand, Household Labour Force Survey customised data.
K5 Adult literacy and numeracy skills
Definition/formulae: The proportion of the population aged 16–65 years with higher literacy and numeracy skills (defined as skills at Level 3 or above), as measured in the 1996 International Adult Literacy Survey (IALS) and the 2006 Adult Literacy and Life Skills Survey (ALL). Prose and document literacy were measured in both surveys; numeracy was measured in the ALL Survey only.
The achievement attained in each of the literacy domains is grouped into one of five “skill levels”. Level 1 represents the lowest ability range and Level 5 the highest. Level 3 is considered a suitable minimum for coping with the demands of everyday life and work in a complex, advanced society. It denotes roughly the skill level required for successful secondary school completion and university entry. Like the higher levels, it requires the ability to integrate several sources of information and solve more complex problems.
Limitations of data: The timing of the surveys is not consistent between countries. The first international adult literacy survey was conducted in 1994/1995; the New Zealand survey took place in 1996. Not all countries participated in the ALL Survey, which was conducted in New Zealand in 2006.
Data sources: Satherley and Lawes (2008a), The Adult Literacy and Life Skills (ALL) Survey: Age and Literacy; Satherley and Lawes (2008b), The Adult Literacy and Life Skills (ALL) Survey: Gender, Ethnicity and Literacy, and customised unpublished data; Satherley et al (2008), The Adult Literacy and Life Skills (ALL) Survey: Overview and International Comparisons.
Paid workTop
PW1 Unemployment
Definition/formulae: The number of people aged 15 years and over who are not employed and who are actively seeking and available for paid work, expressed as a percentage of the total labour force. The data is from the Household Labour Force Survey (HLFS).
The HLFS was introduced in October 1985. It is a continuous national survey of households which measures quarterly average levels of employment, unemployment, non-participation in the labour force, and the quarterly and annual changes in these levels. The survey collects responses from around 15,000 households every quarter, amounting to responses from approximately 30,000 individuals aged 15 and over.
The unemployed are defined in the HLFS as those 15 years and over who are without a paid job (or unpaid work in a relative’s business) and who have actively sought work in the four weeks before the survey, who are available to take work, or who have a new job to start within the next four weeks. “Actively seeking” includes any actions such as contacting an employer, asking friends and relatives and contacting an employment agency or Work and Income, but excludes those who have only checked newspaper advertisements.
Harmonised rates conform with standard International Labour Organization guidelines for comparability.
Limitations of data: Data is based on a sample survey and is therefore subject to sampling error. The definition of the unemployed excludes some people who regard themselves as unemployed, including the “discouraged unemployed” – those not meeting the “actively seeking work” criterion. This group is classified in the “not in the labour force” category. The definition of the unemployed also excludes those who have part-time employment but who are seeking to work more hours.
The HLFS is undergoing progressive revision and past data was rebased in 2015, meaning some past results may have been revised and will differ from previously published data.
A major change in coding ethnicity in the HLFS occurred in the December 2007 quarter. From 2008, people can be counted in more than one ethnic group (total response). This means that the total number of responses for all ethnic groups can be greater than the total number of people who stated their ethnicities. For 2007 and earlier, people are counted in only one ethnic group (ethnicities are prioritised). Ethnic group data from earlier quarters is concorded on a “best fit” basis and may not be directly comparable. People responding “New Zealander” from the December 2007 quarter are coded in European/Other.
Data sources: OECD (2015), Harmonised Unemployment Rate (HUR) (indicator) (accessed 20 August 2015); Statistics New Zealand, Household Labour Force Survey customised and published data.
PW2 Employment
Definition/formulae: The proportion of the population aged 15–64 years employed for at least one hour per week, as measured by the Household Labour Force Survey (HLFS). The employed are those who worked for pay or profit for one hour or more in the week before the survey or who worked unpaid in a relative’s business or who have a job but did not work that week because of leave, sickness or industrial disputes.
See “Unemployment” for information on the HLFS.
The indicator relates to the population aged 15–64 years, rather than to those aged 15 years and over. As well as capturing the main working ages, restricting the subject population to ages 15–64 years helps adjust for differences in age structure between males and females, between ethnic groups, and between populations in different countries.
Limitations of data: Data is based on a sample survey and is therefore subject to sampling error. The definition of employment includes those working one hour or more a week, so this will include some people who are likely to regard their status as closer to unemployment than to employment. For example, people on the unemployment benefit and searching for work but working a few hours a week will be counted as employed.
See “Unemployment” for HLFS limitations of data.
Data sources: OECD (2015), Employment rate (indicator) (accessed on 24 August 2015); Statistics New Zealand, Household Labour Force Survey customised and published data.
PW3 Median hourly earnings
Definition/formulae: Median hourly earnings from all wages and salaries for employees aged 15 years and over earning income from wage and salary jobs, and adjusted for inflation using All Groups Plus Interest.
The data is from the New Zealand Income Survey (NZIS), which is an annual supplement to the Household Labour Force Survey (HLFS) and is run in the June quarter. The HLFS sample has approximately 15,000 private households, sampled randomly from rural and urban areas throughout New Zealand. Information is gathered for each household member who falls within the scope of the survey and meets the survey coverage rules. The final NZIS dataset has approximately 30,000 individuals.
As the survey is run across the June quarter, the price adjustment factor is calculated off June 2014 quarter CPI compared with the quarter concerned.
Limitations of data: Hourly earnings relate to the number of hours usually worked and usual income rather than to the number of hours actually worked and the actual income. Proxy interviewing may be used to collect data on income under certain circumstances.
Changes to the ethnic question from December 2007 preclude ethnic comparisons before this period for the ethnic groups reported.
Estimates from sample surveys are subject to error. Some data reported may differ from published data as a result of using a custom data run. Data used in this report has not been rebased using the latest HLFS population estimates; however, this has little, or no, impact on long-term trends and analysis.
Data source: Statistics New Zealand, New Zealand Income Survey customised and published data.
PW4 Work-related injury
Definition/formulae: The age-standardised rate of serious non-fatal work-related injury per 100,000 person-years at risk. Additional information is provided using Accident Compensation Corporation (ACC) work-related claims data.
Serious non-fatal work-related injury indicators are based on ACC claims and National Minimum Dataset (NMDS) linked data.
Fatal work-related injury indicators are based on ACC fatal claims and WorkSafe New Zealand fatal-harm notifications linked data.
Work-related claims measure claims accepted by ACC for work-related injuries.
Some of the rates provided are based on published data rounded for reasons of confidentiality and as a result may differ slightly from rates published by Statistics New Zealand using unrounded data.
In April 2010, leading central government agencies signed the enduring Protocol for government agency reporting on injury incidence in New Zealand. This protocol ensures that agencies use the serious injury outcome indicators to adopt consistent, high-level injury measures when reporting on injury trends.
Claims submitted by accredited employers were included in the ACC and serious injury data for the first time in 2015, affecting past reported data by increasing the number of claims.
Limitations of data: Non-fatal work-related injury rates are prone to error. Results and commentary reported here reflect 95 percent confidence levels between comparative variables.
Data source: Statistics New Zealand.
PW5 Satisfaction with job
Definition/formulae: The proportion of employed people who are satisfied or very satisfied with their job, as measured by the New Zealand General Social Survey (NZGSS).
See separate technical note for more information on the NZGSS.
Data sources: OECD (2009), Society at a Glance 2009: OECD Social Indicators; Statistics New Zealand, New Zealand General Social Survey 2008, 2010, 2012, 2014 customised data.
PW6 Satisfaction with work-life balance
Definition/formulae: The proportion of employed people who were very satisfied or satisfied with their work-life balance, as measured by the Survey of Working Life (SoWL).
The Statistics New Zealand SoWL investigates people's employment arrangements, employment conditions, and job satisfaction. The 2008 SoWL was a supplement to the Household Labour Force Survey (HLFS) in the March 2008 quarter and the 2012 SoWL was a supplement to the HLFS in the December 2012 quarter. The survey does not collect information on voluntary work or unpaid work around the house.
In 2012, 14,335 employed individuals in households responded to the SoWL. Data is based on a sample survey and so is subject to sampling error. Therefore, results should be treated with a degree of caution.
Data sources: OECD (2015), How’s Life? 2015: Measuring Well-being; Statistics New Zealand, Survey of Working Life 2008 and 2012 customised and published data.
Economic standard of livingTop
EC1 Market income per person
Definition/formulae: The total value of goods and services available to New Zealanders, expressed in inflation-adjusted dollars, per head of population. This is also known as real gross national disposable income (RGNDI) per person. RGNDI measures the total income, adjusted for inflation, that New Zealand residents receive, not only from domestic production but also from the net income flows with the rest of the world. Data is available only from 1991 onward owing to a change in methodology.
Gross national income (GNI) is defined as gross domestic product plus net receipts from abroad of wages and salaries and of property income plus net taxes and subsidies receivable from abroad.
Limitations of data: Major limitations to the use of RGNDI as an indicator of wellbeing include its failure to include non-marketed (and, therefore, non-priced) activities (barring the exception of imputed rentals on owner-occupied dwellings). RGNDI provides no information on income distribution. There is a discontinuity between 1991 and 1992 owing to a change of population series from de facto population to resident population.
Data sources: OECD (2015), Gross national income (indicator) (accessed October 2015); Statistics New Zealand, InfoShare.
EC2 Income inequality
Definition/formulae: The measure used is the ratio of the 80th percentile to the 20th percentile of the equivalised disposable household income distribution (ie the ratio of a high household income to a low household income, after adjusting for household size and composition). The higher this ratio, the greater the level of inequality. For international comparisons, Gini coefficients have been compared.
Adjustment for household size and composition was made using the 1988 Revised Jensen Equivalence Scale.
Data sources: Perry (2015), Ministry of Social Development, using data from Statistics New Zealand's Household Economic Survey.
EC3 Population with low incomes
Definition/formulae: The income measure used is equivalised disposable household income after deducting housing costs. Equivalised disposable household income is the total income from all sources for all individuals in the household, after deducting tax, adding tax credits and adjusting for household size and composition.
The adjustment for household size and composition is based on the 1988 Revised Jensen Equivalence Scale.
Housing costs are the sum of annualised accommodation expenditure (including mortgage payments (principal and interest), payments to local authorities, property rent, rent of a private dwelling, boarding house, and student accommodation not paid with formal fees). In this indicator the Accommodation Supplement is counted as income.
Individuals are ranked by their household’s equivalised disposable income (after deducting housing costs).
Incomes are incomes from all household members from all sources after deducting tax and housing costs, and are adjusted for household size and composition. Three types of threshold are used. The first uses an “anchored” threshold, set at 50 percent of the 2007 household disposable income median, with 25 percent deducted to allow for average housing costs, and held fixed in real terms. This 50 percent of 2007 median measure is equivalent to the 60 percent of 1998 median measure used in previous Social Reports. The two other indicators use fully relative thresholds set at 50 percent and 60 percent of the current year's household disposable income median, with 25 percent deducted to allow for average housing costs. The relative thresholds are adjusted each survey in line with how the median moves.
The trend using an anchored threshold shows how low incomes are changing compared with a fixed standard. The trends using the fully relative thresholds show how low incomes are changing compared with the incomes of middle-income households.
Individuals are grouped according to selected individual, family or household characteristics for the different analyses.
In 2007 and 2009, the Other ethnic group includes the category “New Zealander”.
The methodology used to calculate the figures used in the international comparison section follows that used by the OECD: the income concept is equivalised household disposable income; the equivalence scale is the square root scale (ie equivalence scale elasticity = 0.5); equivalent household income is attributed to all individuals in the household; individuals are ranked by their attributed equivalent disposable income to get the median for that year; the threshold is set at 50 percent of this (contemporary) median, a “moving line” approach. There is no adjustment for housing costs.
Limitations of data: The equivalised disposable income measure (whether before or after deducting housing costs) is taken as an indicator of a household’s access to economic resources or of its potential living standards, all else being equal. The measure is an imperfect indicator of actual living standards, which are influenced by factors other than current income and housing cost. People with the same current income level can have different standards of living as a result of their different net assets, the extent to which they receive assistance from others, and the extent to which they have atypical expenditure commitments (eg unusually high medical costs, debt repayments, transport costs and electricity costs). People who experience a lengthy period of very low income are likely to have different life outcomes from those who experience only a transient episode.
Data sources: Perry (2015), Ministry of Social Development, using data from Statistics New Zealand's Household Economic Survey; OECD (2015), Poverty Rate (indicator) (accessed 07 October 2015).
EC4 Material hardship
Definition/formulae: The proportion of the population in households with Material Wellbeing Index (MWI) scores below two thresholds.
The Ministry of Social Development's MWI is made up of 24 items that reflect the actual living conditions and consumption opportunities for households. The index ranks households by their material wellbeing. Two thresholds are used, representing more severe and less severe hardship. For 2009, these thresholds produce material hardship rates for New Zealand that are very close to those produced by the two thresholds used in the Eurostat's 13-item deprivation index for the same year (the latest comparison available).
Results for 2007–2012 use the Economic Living Standard Index Short Form (ESF-1) with thresholds chosen to mesh with the MWI used in 2013 and 2014.
Ethnicity used is prioritised, not total response (each person is captured in one ethnic group only).
Data sources: Perry (2015a), Ministry of Social Development, using data from Statistics New Zealand's Household Economic Survey.
EC5 Housing affordability
Definition/formulae: The proportion of households and the proportion of people within households with housing cost outgoings-to-income ratio greater than 30 percent of disposable income.
Household incomes have been equivalised using the 1988 Revised Jensen Equivalence Scale.
Housing costs are the sum of annualised accommodation expenditure (including mortgage payments (principal and interest), payments to local authorities, property rent, rent of a private dwelling, boarding house, and student accommodation not paid with formal fees). In this indicator the Accommodation Supplement is counted as income.
Limitations of data: Measures of housing affordability do not shed light on the issues of housing quality, suitability or sustainability; nor do they explain why affordability problems may exist, or the extent to which inadequate housing is occupied to avoid affordability problems. Furthermore, marginally housed families are often hidden from official statistics, and are not counted among those with an affordability problem.
Household ethnicity is defined in this indicator by the presence of an adult of a particular ethnic group. The figures for households defined in this way are not mutually exclusive.
Data sources: Perry (2015a), Ministry of Social Development, using data from Statistics New Zealand's Household Economic Survey.
EC6 Household crowding
Definition/formulae: The proportion of the population living in crowded housing (ie requiring one or more additional bedrooms (as defined by the Canadian Crowding Index)).
The Canadian National Occupancy standard sets the bedroom requirements of a household according to the following compositional criteria:
- There should be no more than two people per bedroom.
- Parents or couples share a bedroom.
- Children aged under 5 years, either of the same or of the opposite sex, may reasonably share a bedroom.
- Children aged under 18 years of the same sex may reasonably share a bedroom.
- A child aged 5–17 years should not share a bedroom with a child aged under 5 years of the opposite sex.
- Single adults 18 years and over and any unpaired children require a separate bedroom.
Limitations of data: There is no contemporary official statistic or index of household crowding in New Zealand. There are many frameworks or models used in many countries for analysing the incidence of crowding. It is unlikely any single measure of crowding could adequately summarise such a complex and multi-faceted issue as crowding.
Data sources: Ministry of Health (2014), Analysis of Household Crowding based on Census 2013 data; Statistics New Zealand, Unpublished data from the Census of Population and Dwellings 1986, 1991, 1996, 2001, 2006 and 2013.
Civil and political rightsTop
CP1 Voter turnout
Definition/formulae: The proportion of the estimated voting-age population (aged 18 years and over) who cast a vote in general elections; the proportion of all enrolled electors (both resident and ratepayer) who cast a vote in contested local authority elections.
The total number of votes cast is divided by the estimated number of people who would have been eligible to vote (voting-age population) on election day in contested wards, and expressed as a percentage. To be eligible to vote, a person must be at least 18 years old and meet residential and certain other criteria. Voter turnout for the general elections is collected by the Electoral Commission, and by the Department of Internal Affairs for local authority elections.
Ethnicity is based on the ethnic group(s) that people identify with or feel they belong to. It is a measure of cultural affiliation rather than race, ancestry, nationality or citizenship.
See separate technical note for more information on the New Zealand General Social Survey (NZGSS).
Limitations of data: The voting-age population is based on population estimates that are subject to revision. The 1984 figure is based on the estimated de facto population aged 18 years and over, as at 30 June 1984.
Statistics New Zealand's Non-voters in 2008 and 2011 general elections report is based on self-reported voting behaviour, and therefore findings can be different from administrative data on voter turnout available from the Electoral Commission’s website. Reasons for possible differences include:
- NZGSS collects self-reporting voting behaviour.
- The voting population used in the analysis is people aged 18 years and over in the election year who provided valid responses to the survey questions.
- The voting population used in this report includes people who were not enrolled or not eligible because of visa status, which have been classified under “other” reasons for not voting.
See the Electoral Commission’s research paper: Voter and non-voter satisfaction survey 2011 on voter turnout.
Survey estimates are subject to sampling error and small differences between groups may not be statistically significant. Groups with small population size, such as Pacific peoples and MELAA, can potentially be vulnerable to unmeasured differences between the survey participants and the population.
Data sources: Department of Internal Affairs (2014), 2013 Local Authority Election Statistics; Electoral Commission (2015), Report of the Electoral Commission on the 2014 General Election; Electoral Commission (2012), Report of the Electoral Commission on the 2011 General Election and Referendum; International Institute for Democracy and Electoral Assistance (2015), Voter Turnout (accessed June 2015); Statistics New Zealand (2014), Non-voters in 2008 and 2011 General Elections: Findings from the New Zealand General Social Survey; Statistics New Zealand, New Zealand General Social Survey 2008, 2010, 2012 customised data.
CP2 Representation of women in government
Definition/formulae: The proportion of elected Members of Parliament (MPs) who were women and the proportion of women elected to local authorities.
International data has been compiled by the Inter-Parliamentary Union on the basis of information provided by National Parliaments by 1 May 2015.
Data sources: Department of Internal Affairs (2014), 2013 New Zealand Local Authority Elections; Department of Internal Affairs (2011), Local Authority Election Statistics 2010; Electoral Commission (2002), The New Zealand Electoral Compendium, 3rd edition; Inter-Parliamentary Union (2015), Women in National Parliaments (accessed June 2015); Parliamentary Library (2015), The 2014 New Zealand General Election: Final Results and Voting Statistics; Parliamentary Library (2012), Final Results for the 2011 New Zealand General Election and Referendum; Parliamentary Library (2008), Final Results for the 2008 New Zealand General Election; Parliamentary Library (2005), Final Results 2005 General Election.
CP3 Representation of ethnic groups in government
Definition/formulae: The proportion of elected Members of Parliament (MPs) who identified themselves as being of Māori, Pacific peoples or Asian ethnicity.
Limitations of data: Ethnicity is self-defined.
Data sources: Parliamentary Library (2015), The 2014 New Zealand General Election: Final Results and Voting Statistics; Parliamentary Library (2012), Final Results for the 2011 New Zealand General Election and Referendum; Parliamentary Library (2008), Final Results for the 2008 New Zealand General Election; Parliamentary Library (2005), Final Results 2005 General Election; Statistics New Zealand (2014), 2013 Census Quick Stats about Culture and Identity.
CP4 Perceived discrimination
Definition/formulae: The proportion of the population aged 15 years and over who reported they had been discriminated against in the past 12 months, as measured in the 2014 New Zealand General Social Survey (NZGSS).
See the separate technical note for more information on the NZGSS.
Limitations of data: This measure is subjective and reflects personal perceptions of discrimination by individuals, rather than instances of discrimination established by law.
The question on discrimination in the 2014 NZGSS is worded differently from in previous surveys. The change in wording means that comparisons across time cannot be made.
Data sources: European Commission (2012), Discrimination in the EU in 2012; Statistics New Zealand (2015), New Zealand General Social Survey 2014 customised data.
CP5 Acceptance of diversity
Definition/formulae: The proportion of the population aged 15 years and over who reported feeling “very comfortable” or “comfortable” if they had a new neighbour who was a member of a selected range of minority groups, as measured in the 2014 New Zealand General Social Survey (NZGSS). The minority groups were: from a religious minority; gay, lesbian, bisexual or transgender (GLBT); a racial or ethnic minority; had a mental illness; or was a new migrant.
See separate technical note for more information on the NZGSS.
Limitations of data: The question about acceptance of diversity in the 2014 NZGSS is worded differently than in previous surveys. The change in wording means it is not possible to make comparisons across time.
Data source: Statistics New Zealand (2015), New Zealand General Social Survey 2014 information release and customised data.
CP6 Perceived corruption
Definition/formulae: The perceived level of corruption – defined as “the abuse of public office for private gain” – among New Zealand politicians and public officials, on a scale of 1 (highly corrupt) to 100 (highly clean), as measured in the Corruption Perceptions Index (CPI) by Transparency International.
The CPI ranks countries and territories based on how corrupt their public sector is perceived to be. It is a composite index – a combination of polls – drawing on corruption-related data collected by a variety of reputable institutions. The CPI reflects the views of observers from around the world, including experts living and working in the countries and territories evaluated.
The 2014 CPI draws on data sources from independent institutions specialising in governance and business climate analysis. The sources of information used for the 2014 CPI are based on data gathered in the past 24 months. The CPI includes only sources that provide a score for a set of countries/territories and that measure perceptions of corruption in the public sector. Transparency International reviews the methodology of each data source in detail to ensure that the sources used meet Transparency International’s quality standards.
The CPI has information on 175 countries and territories in 2014, but the indicator focuses on the 34 OECD countries.
Limitations of data: The CPI is limited in scope and is a subjective measure, capturing perceptions of the extent of corruption in the public sector, from the perspective of business people and country experts. The index is a relative measure: New Zealand's ranking depends not only on perceptions of corruption in New Zealand but also on perceptions of corruption in the other countries surveyed.
Transparency International updated the methodology used to calculate the CPI in 2012 using a new scale of 0-100 rather than scores out of 10. Using this scale, CPI scores can now be compared from one year to the next. CPI scores before 2012 are not comparable over time.
Data source: Transparency International (2014), Corruption Perceptions Index 2014.
Cultural identityTop
CI1 Local content programming on New Zealand television
Definition/formulae: The hours of local content broadcast on TV One, TV2, TV3, Prime Television, Māori Television and FOUR in prime-time, expressed as a percentage of the total prime-time schedule. New Zealand content programming includes first runs and repeats across all main channels.
Limitations of data: The number of local content hours broadcast on other free-to-air or pay channels is not included in the data presented here.
For Table CI1.1, programme hours are divided into eight genre categories. Nielsen allocates programmes a description from their catalogue of more than 40 typographies, which are then automatically assigned to the eight genres measured in this report. The genres are defined in Appendix 1 of 2014 Local Content New Zealand Television. There are some variances in the way programmes are classified by genre. NZ On Air uses the classifications allocated by Nielsen, and because NZ On Air's interest is in trends over time, it doesn’t change these even if the variance may seem a bit at odds. For example, two similar programmes may appear in different genre. In 2014, weekend current affairs programme Q+A is classified as News/Current Affairs, but The Nation on TV3 is counted as Information. A full list of each programme and the genre it is allocated to is in Appendix 6 of 2014 Local Content New Zealand Television.
In 2010, there were methodological changes. NZ On Air started using electronic Nielsen data, rather than an in-house manual recording system. Nielsen's data records changes to advertised programming, and actual rather than estimated running times. This generally means a decrease in total hours. In addition, there are some changes to the category (genre) to which a programme title might be assigned. Year-on-year genre comparisons before 2010 should be interpreted with caution.
Because of the methodological changes, and to align with NZ On Air reporting, data in the 2016 Social Report starts from 2006. This differs from previous Social Reports.
Data source: NZ On Air (2014), 2014 Local Content New Zealand Television.
CI2 Māori language speakers
Definition/formulae: Māori language speakers as a proportion of the Māori ethnic group. Māori language speakers are defined as those able to hold a conversation about everyday things in Māori, as measured by the Census of Population and Dwellings 2001, 2006 and 2013.
In 2013, Statistics New Zealand carried out Te Kupenga, its first survey of Māori wellbeing. Te Kupenga collected information on a wide range of topics to give an overall picture of the social, cultural, and economic wellbeing of Māori in New Zealand.
Limitations of data: The census data relies on self-assessment, rather than on measuring the actual level of fluency in the population. It comes from a single question about conversational language ability.
The Te Kupenga 2013 survey measured a sample of the population who identified ethnically as Māori and/or as being of Māori descent. Te Kupenga involved face-to-face interviews, in either te reo Māori or English. The census involves people completing a questionnaire on their own. Te Kupenga and census data are therefore not comparable.
For more information, see Statistics New Zealand (2014) Measuring te reo Māori speakers: A guide to different data sources, available from www.stats.govt.nz.
Data sources: Statistics New Zealand, Census of Population and Dwellings 2001, 2006 and 2013; Statistics New Zealand (2014), Māori language speakers (tables); Statistics New Zealand (2014), Ka mārō te aho tapu, ka tau te korowai: Te reo Māori findings from Te Kupenga 2013.
CI3 Language retention
Definition/formulae: The proportion of people who could speak the “first language” of their ethnic group, as recorded in the 2013 Census. The ability to speak a first language is defined as being able to hold an everyday conversation in that language. First language refers to the first language associated with a given ethnicity, as opposed to the first language of a person. Sign language, English and Māori are not treated as a first language for the purpose of the indicator.
Limitations of data: While a direct link can usually be made between a language and an ethnic group, this is not always the case. Some ethnicities are associated with several languages and one language can span several ethnicities. Because the ethnic group census variables allow more than one response, there may be some individuals who appear in more than one ethnic group category.
Data source: Statistics New Zealand, unpublished data from the Census of Population and Dwellings 2001, 2006 and 2013.
CI4 Ability to be yourself in New Zealand
Definition/formulae: The proportion of the population aged 15 years and over who felt it was “very easy” or “easy” to be themselves in New Zealand, as measured in the 2014 New Zealand General Social Survey (NZGSS).
See the separate technical note for more information on the NZGSS.
Limitations of data: The question in the 2014 NZGSS is worded differently from in previous surveys. The change in wording means comparisons across time cannot be made.
Data source: Statistics New Zealand (2015), New Zealand General Social Survey 2014 customised data.
Leisure and recreationTop
L1 Satisfaction with leisure time
Definition/formulae: The proportion of the population aged 15 years and over who reported having the right amount of free time in the last four weeks, as measured in the New Zealand General Social Survey (NZGSS).
See separate technical note for more information on the NZGSS.
Limitations of data: No data was collected in the 2014 NZGSS.
Data source: Statistics New Zealand, New Zealand General Social Survey 2008, 2010, 2012 customised data.
L2 Participation in arts and cultural activities
Definition/formulae: The proportion of the population aged 15 years and over who had attended at least one arts event or who had actively participated in the arts in the previous 12 months, as measured by the New Zealanders and the Arts Survey.
The New Zealanders and the Arts Survey is a major three-yearly research programme by Creative New Zealand that began in 2005. It delivers ongoing information to the arts sector about New Zealanders’ level of involvement in, and attitudes towards, the arts.
There were two components of the 2014 research conducted by Colmar Brunton:
• 1,001 telephone interviews with New Zealanders aged 15 or over;
• 180 door-to-door interviews with three ethnic groups – Māori, Pacific peoples, and Asian – to provide more robust sample sizes of specific ethnic groups.
After interviewing, the two samples were merged to create a final sample size of n=1,181, which has a maximum margin for error of +/-2.85 percent.
To account for sample imbalances created by the sampling process and the ethnic booster samples, the final sample was weighted to match the New Zealand 15+ population as per the 2013 Census. The sample was weighted to account for the impact of household size, and to correct imbalances in terms of region, gender, age and ethnicity.
Limitations of data: Data is based on a sample survey and is therefore subject to sampling error. International comparisons are affected by differences in the collection and classification of data.
Data sources: Creative New Zealand (2015), New Zealanders and the Arts: Attitudes, Attendance and Participation in 2014 published and customised data; TNS Opinion & Social (2013), Cultural Access and Participation Report – Special Eurobarometer 399.
SafetyTop
SS1 Criminal victimisation
Definition/formulae: The proportion of the population aged 15 years and over who reported having a crime committed against them in the last 12 months, as measured in the New Zealand General Social Survey (NZGSS).
Previously the New Zealand Crime and Safety Survey (NZCASS) was used as a data source but the NZGSS was chosen for this report as it occurs more regularly, and looks at the whole population.
See separate technical note for more information on the NZGSS.
Limitations of data: Changes in the explanation of crime given to survey respondents in 2014 mean that comparisons between 2008, 2010, 2012 and 2014 should be treated with caution.
Data sources: OECD (2014), Society at a Glance 2014: OECD Social Indicators; Statistics New Zealand, New Zealand General Social Survey 2008, 2010, 2012, 2014 customised data.
SS2 Fear of crime
Definition/formulae: The proportion of the population aged 15 years and over who felt safe or very safe walking alone in their neighbourhood after dark, as measured in the 2014 New Zealand General Social Survey (NZGSS).
See separate technical note for more information on the NZGSS.
Limitations of data: Changes to the “fear of crime” question in the NZGSS have meant no comparisons can be made over time. These changes have included changing the scale from a 4 point scale to a 5 point scale, and rewording the question.
International data comes from the Gallup World Poll (http://www.gallup.com/services/170945/world-poll.aspx), and caution is needed when making international comparisons because of varying sample sizes. International rates are calculated omitting “don't know” and “refused” from the denominator.
Data sources: OECD (2014), Society at a Glance 2014: OECD Social Indicators; Statistics New Zealand, New Zealand General Social Survey 2014 information release and customised data.
SS3 Assault mortality
Definition/formulae: The number of people who have died as a result of an assault, per 100,000 population. The data was drawn from the following International Classification of Diseases codes: ICD-8 and ICD-9, E960-E969 (up to 1999); ICD-10, X85-Y09 (from 2000).
Limitations of data: Because of a change in the ethnicity classification in September 1995 (from ancestry to self-reported), comparable data is available only from 1996 onwards. Rates based on small numbers can be volatile and trends can be difficult to determine over the short term.
Data sources: Ministry of Health, customised data; New Zealand Transport Agency, customised data; Statistics New Zealand, New Zealand Social Indicators website.
SS4 Road casualties
Definition/formulae: The number of deaths caused by motor vehicle crashes per 100,000 population; the number of persons injured as a result of motor vehicle crashes as reported to the police per 100,000 population. Pedestrians or cyclists killed or injured by motor vehicles are included.
The data for land transport accident deaths is drawn from the following International Classification of Diseases codes: ICD-10, V01-V89 (from 2000).
Road casualty data comes from two main sources: injury data from the traffic crash reports completed by police officers who attend the fatal and injury crashes; and mortality and hospitalisation data from the Ministry of Health. Ethnic-specific rates of death or hospitalisation are available only from the Ministry of Health.
Limitations of data: Because of a change in the ethnicity classification in September 1995 (from ancestry to self-reported), comparable data is available only from 1996 onwards.
Data sources: Ministry of Health, customised data; New Zealand Transport Agency, customised data; Statistics New Zealand; OECD (2015), Health at a Glance 2015: OECD Indicators; OECD (2013), Health at a Glance 2013: OECD Indicators; International Transport Forum, International Road Traffic and Accident Database.
Social connectednessTop
SC1 Telephone and internet access in the household
Definition/formulae: The number of people living in households with access to telephones (either landline and/or cellphone) and the internet, as a percentage of the total population for whom access to communications was available, as measured in the Census of Population and Dwellings 2001, 2006 and 2013.
Limitations of the data: This data is collected at the household level, not at the individual or family level. The circumstances of each individual or family in a household may differ.
Data source: Statistics New Zealand, Census of Population and Dwellings 2001, 2006 and 2013.
SC2 Contact with family and friends
Definition/formulae: The proportion of the population aged 15 years and over who said the amount of contact they had with family and friends who didn’t live with them was “about right”, as measured in the 2008, 2010 and 2012 New Zealand General Social Survey (NZGSS).
See separate technical note for more information on the NZGSS.
Limitations of data: In the 2014 NZGSS, the question on contact with family and friends was changed to draw from a different population of respondents. For this reason, comparisons cannot be made with previous survey data and 2014 data has, therefore, not been included.
Data source: Statistics New Zealand (2015), New Zealand General Social Survey 2014 customised data.
SC3 Contact between young people and their parents
Definition/formulae: The proportion of secondary school students aged 12–18 years who said they got enough time with mum and/or dad (or someone who acts as mum and/or dad) most of the time, as measured in the Youth2000, Youth’07 and Youth’12 surveys.
NZDep2006 Index is an updated version of earlier indexes of socio-economic deprivation and combines nine variables from the 2006 Census which reflect dimensions of deprivation. The NZDep2006 Index uses a scale from 1 to 10 which divides the distribution of the NZDep2006 score for the total New Zealand population into equal tenths. A decile of 1 represents areas with the least deprived scores and 10 represents areas with the most deprived scores. Students are grouped into three decile bands, indicating low (1 – 3), medium (4 – 7) and high (8 – 10) levels of deprivation. It should be noted that NZDep2006 deprivation scores apply to areas rather than individual people.
Limitations of data: Estimates from sample surveys are subject to error. The achieved sample size for the Youth'12 survey was 8,500 students, representing 3.0 percent of the total 2012 New Zealand secondary school roll.
The Youth’12 survey is a school-based survey of students who were at school on the day of the survey. Students who were not at school or who had dropped out of school are generally less healthy and experience greater health needs.
The question format and response options changed between 2001 and 2007/2012. In 2001, students were asked, “Most weeks you get enough time to spend with your mum/dad (or someone who acts as your mum/dad)?”, whereas in 2007/2012 students were asked, “Do you [get to] spend enough time with her/him (your mum/dad or someone who acts as your mum/dad)?” In 2001, the response options were: Always, Sometimes, Hardly ever, Almost never, and Does not apply to me. In 2007/2012, the response options were: Most of the time, Sometimes, Hardly ever, and Does not apply to me.
Data sources: Adolescent Health Research Group (2013), The Health and Wellbeing of New Zealand Secondary School Students in 2012: Youth'12 Prevalence Tables; Adolescent Health Research Group (2008), Youth'07: The Health and Wellbeing of Secondary School Students in New Zealand: Technical Report.
SC4 Trust in others
Definition/formulae: The proportion of the population aged 15 years and over who reported trusting most people in New Zealand, as measured in the 2014 New Zealand General Social Survey (NZGSS).
See separate technical note for more information on the NZGSS.
OECD trust data is based on the question: “Generally speaking would you say that most people can be trusted or that you need to be very careful in dealing with people?” Data comes from two different surveys: the European Social Survey (2008 wave 4) for OECD-Europe and the International Social Survey Programme (2007 wave) for non-OECD Europe.
Limitations of data: The question about generalised trust in the 2014 New Zealand General Social Survey is a new question so no time series is available.
Data source: Statistics New Zealand (2015), New Zealand General Social Survey 2014 customised data.
SC5 Loneliness
Definition/formulae: The proportion of the population aged 15 years and over who reported feeling lonely all of the time, most of the time, or some of the time in the last four weeks, as measured in the 2014 New Zealand General Social Survey (NZGSS).
See separate technical note for more information on the NZGSS.
Limitations of data: The question about loneliness in the 2014 NZGSS is worded differently from in previous surveys. The change in question means comparisons across time cannot be made.
Data source: Statistics New Zealand (2015), New Zealand General Social Survey 2014 customised data.
SC6 Voluntary work
Definition/formulae: The proportion of the population aged 15 years and over who reported having done voluntary work for a group or organisation in the past four weeks, as measured in the New Zealand General Social Survey (NZGSS).
Examples of groups or organisations given to survey respondents included sports or exercise groups; hobby, recreation or social groups; ethnic or cultural groups; environmental or animal welfare groups; business, professional or union groups; political or lobby groups; health, welfare or support groups; local community or neighbourhood groups; and emergency services.
See separate technical note for more information on the NZGSS.
Limitations of data: No data was collected in the 2014 NZGSS. International data comes from the Gallup World Poll, and caution is needed when making international comparisons owing to varying sample sizes.
Data sources: OECD (2015), “Women are catching up to men in volunteering, and they engage in more altruistic voluntary activities”; Statistics New Zealand (2015), New Zealand General Social Survey 2014 customised data.
Life satisfactionTop
LS1 Overall life satisfaction
Definition/formulae: The proportion of the population aged 15 years and over who rated their overall life satisfaction highly (ie scored 7 and over on a scale of 0–10, with 0 being completely dissatisfied and 10 being completely satisfied), as measured in the New Zealand General Social Survey (NZGSS).
International data comes from the Gallup World Poll with the reference year being 2014 for all countries with the exception of 2013 for Chile, Hungary and Iceland. The indicator considers people's evaluation of their life as a whole. It is a weighted-sum of different response categories based on people’s ratings of their current life relative to the best and worst possible lives for them on a scale from 0 to 10, using the Cantril Ladder (known also as the “Self-Anchoring Striving Scale”).
See separate technical note for more information on the NZGSS.
Limitations of data: Given changes to the scale in 2014, comparisons with previous NZGSS life satisfaction results cannot be made.
Data sources: OECD (2015), Better Life Index 2015; Statistics New Zealand (2015), New Zealand General Social Survey 2014 customised data.
New Zealand General Social SurveyTop
Definition/formulae: The New Zealand General Social Survey (NZGSS) is a multi-dimensional, biennial survey that provides information on the wellbeing of New Zealanders aged 15 years and over. It covers a wide range of social and economic outcomes and shows how people are faring. In particular, the survey provides a view of how wellbeing outcomes are distributed across different groups within the New Zealand population. The NZGSS began in 2008 and has run every two years since then (ie 2010, 2012 and 2014).
The target population for the NZGSS is the usually resident population aged 15 years and over in private dwellings in the North Island, South Island, or Waiheke Island of New Zealand.
Households are selected at random using a multistage sample design.
The NZGSS is made up of two questionnaires: the household questionnaire and the personal questionnaire. One individual in the household completes the household questionnaire, which collects information about all the residents in the household (eg family relationships and household income). One individual in the household aged 15 years or over answers the personal questionnaire – that individual is randomly selected from within the eligible members of the household (a computer-generated random selection). Interviews are conducted using computer-assisted personal interviews (CAPI), lasting an average of 45 minutes. The data collection period takes place over a 12-month period from April to March.
The target response rate for the survey was 80 percent. The achieved response rate for 2014 was 80 percent, with 8,795 individuals answering the personal questionnaire. The achieved response rate is similar to previous surveys: 78 percent (2012); 81 percent (2010); and 83 percent (2008).
The “Other” group which includes “New Zealander” and “‘Other’ Other ethnicity” has been grouped with New Zealand European. While this differs from how the NZGSS is reported by Statistics New Zealand, it aids in comparing ethnicity across time and reflects that the Other group is closely aligned with the European group. This also follows the approach undertaken in previous Social Reports.
Recent migrant refers to a migrant who arrived in New Zealand in the last five years. Long-term migrants have lived in New Zealand for more than five years.
The Material Wellbeing Index has been used to provide information on socio-economic differences. See the technical note on socio-economic measures used in this report.
Limitations of data:
The NZGSS collects subjective self-reported information which is based on individuals’ perceptions, and some information may be under- or over-reported.
Survey estimates are subject to sampling error and small differences between groups may not be statistically significant.
Groups with small population size, such as Pacific peoples and the Middle Eastern/Latin American/African (MELAA) group, can potentially be vulnerable to unmeasured differences between the survey participants and the population.
Changes have been made to some of the survey questions, which has affected the comparability of their results over time. Where this has occurred, it has been highlighted in the individual indicator sections.
Differences between the figures in the Social Report and Statistics New Zealand published figures occasionally occur for a variety of reasons, including the rounding of numbers, the aggregation of categories, and the use of different denominations as a result of different definitions.
Further technical information can be found on Statistics New Zealand’s website: http://www.stats.govt.nz/browse_for_stats/people_and_communities/well-being/nzgss-info-releases.aspx
Socio-economic measures used in this reportTop
In this report we use a range of measures to report on differences in outcomes according to socio-economic status (SES). SES is usually defined in terms of a combination of income, education and occupation. The report uses several proxies for SES as outlined below:
Personal income and household income
Material wellbeing index (MWI)
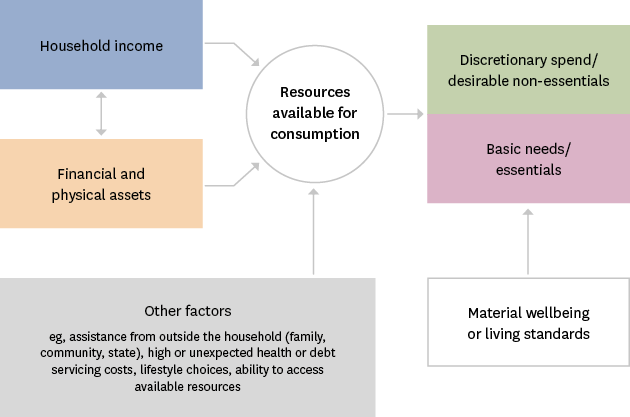
The MWI is a survey-based measure of the material living standards of households. It is a revised and updated version of the Ministry of Social Development’s Economic Living Standards Index (ELSI) which was developed in 2002. Like the ELSI, the MWI ranks households by their index scores based on two perspectives:
- an enforced lack perspective in which respondents report not having basics or essentials because of the cost and need to purchase other basics (eg good meal once a day, keeping house warm, having a good bed, going to the doctor, dealing with unexpected essential expenses, and so on);
- a freedoms enjoyed perspective looking at the degrees of restriction for having or purchasing non-essentials (eg pursuing hobbies, taking overseas holidays, using the car without restriction, always being able to replace or fix appliances that break down without delay, and so on).
See Figure AP3.1.
The full MWI uses 24 items with scores ranging from 0 (very severe material hardship) to 35 (very high living standards). The MWI discriminates better in the low and middle parts of the living standards spectrum, but is useful across the full spectrum. In practice it is sensible to clump the top 20% or so into a “high living standards” group rather than try to make too much of slightly different scores at the top end. The 24 items are available in Statistics New Zealand’s Household Economic Survey and the full MWI is used in the Economic Standard of Living domain in this report.
Table AP3.1 – Size of the four MWI groupings used in this report
| MWI-9 level | 1 | 2 | 3 | 4 |
|---|---|---|---|---|
| Label | lower | lower middle | upper middle | higher |
| MWI scores | 0-8 | 9-13 | 14-17 | 18-20 |
| GSS 2014 | 15% | 23% | 31% | 32% |
| HES 12-13 and 13-14 (avg) | 16% | 24% | 28% | 32% |
The New Zealand Deprivation Index (NZDep2013)
NZDep was first developed using 1991 Census data and earlier versions of the index may be used in this report.
School funding deciles
A school’s decile measures the extent to which the school’s students live in low-socio-economic or poorer communities. Decile 1 schools are the 10 percent of schools with the highest proportion of students from low-socio-economic communities. Decile 10 schools are the 10 percent of schools with the lowest proportion of students from these communities.
Decile ratings are based on census data for households with school-aged children in each school’s catchment area. The data uses household measures such as income, parents on a benefit, occupation, education, and household crowding.
Decile ratings are for funding purposes only – they are not an indication of the performance or quality of education delivered at a school or kura. They are used in this report as a proxy for socio-economic status.
Low incomes and material hardship framework
The framework recognises the importance of household income as a key economic resource for determining consumption possibilities and therefore the material wellbeing of households, as well as the fact that financial and physical assets and many other factors also have an impact on material wellbeing. One consequence of this is that the overlap between those with low incomes and those with low material wellbeing is typically only 40–50 percent – not all with low incomes are in hardship and not all in hardship have low incomes.
Figure AP3.1 – Income and material hardship framework