Paid work
Unemployment
Definition
The number of people aged 15 years and over who were not employed and who were actively seeking and available for paid work, expressed as a percentage of the total labour force.
RelevanceTop
Unemployment is a key indicator of labour market outcomes and the lack of access to employment. The unemployment rate is an important reflection of overall economic conditions, and it gives some sense of the ease with which people are able to move into employment.
Current level and trendsTop
In the year ended December 2014, 5.8 percent of the labour force (or 140,800 people) were unemployed and actively seeking work, a decrease from 6.2 percent (or 148,400 people) in the year ended December 2013.
Historically, the unemployment rate reached a peak of 10.7 percent in 1992 (180,900 unemployed people). The lowest unemployment rate recorded was 3.7 percent in 2007. The impact of the 2008 Global Financial Crisis is clearly seen over the more recent period. The unemployment rate increased from 2007 to peak at 6.9 percent in 2009, before again falling.
In 2014, the duration rate (ie those unemployed for a continuous period of one year of more) was 13.6 percent (16,700 unemployed people). This was an increase compared with the previous year (12.2 percent). The duration rate peaked at 33.7 percent in 1993 (52,400 unemployed people). The lowest duration rate was 4.6 percent in 2008.
The proportion of people seeking full-time work (30 hours or more per week) in the year ended December 2014 was 4.7 percent (4.2 percent for males and 5.4 percent for females). For those seeking part-time work (less than 30 hours per week), the proportion was 9.2 percent (10.7 percent for males and 8.7 percent for females).
Figure PW1.1 – Unemployment rate, 1986–2014
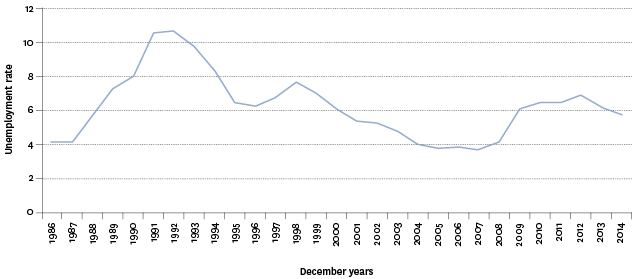
Source: Statistics New Zealand, Household Labour Force Survey
Note: Year ended December.
Age and sex differencesTop
Unemployment rates for different age groups follow similar trends, but are consistently higher among youth. In 2014, the unemployment rate for 15–24 year olds (15.0 percent) was close to three times the rate of the next highest age group – those aged 25–34 years (5.9 percent).
Unemployment rates for males and females have followed similar trends over time, but which sex has had the higher rate has changed a number of times over the period of the survey. In 2014, females had the higher rate at 6.5 percent compared with 5.0 percent for males, a pattern that has persisted since 2006.
Table PW1.1 – Unemployment rate, by age group and sex, selected years 1986–2014
| Year | 15–24 | 25–34 | 35–44 | 45–54 | 55–64 | Male 15+ | Female 15+ | Total 15+ |
|---|---|---|---|---|---|---|---|---|
| 1986 | 8.1 | 4.0 | 2.3 | 2.1 | 1.6 | 3.7 | 4.9 | 4.2 |
| 1991 | 19.3 | 11.1 | 7.1 | 6.6 | 5.4 | 11.3 | 9.8 | 10.6 |
| 1996 | 12.2 | 6.1 | 4.8 | 4.1 | 3.7 | 6.3 | 6.3 | 6.3 |
| 2001 | 12.1 | 5.0 | 4.3 | 3.3 | 3.6 | 5.5 | 5.4 | 5.4 |
| 2006 | 9.9 | 3.6 | 2.5 | 2.2 | 2.0 | 3.5 | 4.2 | 3.9 |
| 2007 | 10.1 | 3.4 | 2.4 | 2.0 | 1.5 | 3.4 | 4.0 | 3.7 |
| 2008 | 11.4 | 4.0 | 2.7 | 2.3 | 2.0 | 4.1 | 4.3 | 4.2 |
| 2009 | 16.8 | 5.7 | 4.1 | 3.7 | 3.2 | 6.1 | 6.2 | 6.1 |
| 2010 | 17.4 | 6.8 | 4.3 | 3.9 | 3.5 | 6.2 | 6.9 | 6.5 |
| 2011 | 17.5 | 6.0 | 4.8 | 4.1 | 3.3 | 6.3 | 6.8 | 6.5 |
| 2012 | 18.0 | 6.8 | 4.9 | 4.6 | 4.0 | 6.5 | 7.4 | 6.9 |
| 2013 | 16.2 | 6.2 | 4.5 | 3.9 | 4.0 | 5.6 | 6.9 | 6.2 |
| 2014 | 15.0 | 5.9 | 4.1 | 3.6 | 3.2 | 5.0 | 6.5 | 5.8 |
Source: Statistics New Zealand, Household Labour Force Survey
Note: Year ended December.
Ethnic differencesTop
The Māori unemployment rate peaked at 25.6 percent in 1992, and reached a low of 7.9 percent in 2007. The Māori unemployment rate in 2014 was 12.3 percent, a decrease from 13.1 percent at the same time the previous year. The Pacific peoples’ unemployment rate peaked at 27.5 percent in 1991 and reached a low of 6.5 percent in 2005. The Pacific peoples’ unemployment rate in 2014 was 12.0 percent, a decrease from a rate of 15.3 percent at the same time the previous year. Pacific peoples and Māori consistently have higher unemployment rates than the population overall.
The European/Other unemployment rate peaked at 8.6 percent in 1991 and reached a low of 2.9 percent in 2007. The European/Other unemployment rate in 2014 was 4.4 percent, a decrease from 4.9 percent at the same time the previous year. The Asian unemployment rate peaked at 13.4 percent in 1991 and reached a low of 4.3 percent in 1987. The Asian unemployment rate in 2014 was 6.8 percent, an increase from 6.5 percent at the same time the previous year.
As noted, youth experience higher unemployment rates. This is a particular concern for Māori and Pacific peoples, who have relatively youthful populations. In 2014, for those aged 15–24 years, Pacific peoples, Māori, those in the Asian ethnic group and European/Other had unemployment rates of 25.9, 22.5, 16.0 and 12.4 percent respectively.
Figure PW1.2 – Unemployment rate, by ethnic group, 1986–2014
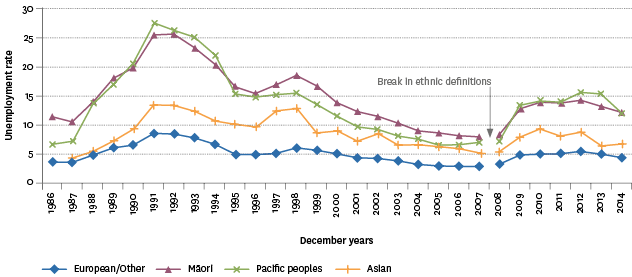
Source: Statistics New Zealand, Household Labour Force Survey
Notes: Year ended December. For 2007 and earlier, people are counted in only one ethnic group (ethnicities are prioritised). From 2008, people can be counted in more than one ethnic group (total response). Caution should be used when comparing the two ethnic series over time.
Asian rates are suppressed in 1986 because of small numbers.
Regional differencesTop
Northland had the highest unemployment rate at 8.4 percent for the year ended December 2014, while Canterbury had the lowest at 3.2 percent. Auckland had the highest number of unemployed at 52,500, while Southland had the lowest at 2,000.
International comparisonTop
In 2014, the harmonised New Zealand unemployment rate of 5.8 percent was ranked 8th lowest out of 33 OECD countries. This was lower than the OECD median of 6.9 percent and compares with a rate of 6.1 percent in Australia, and 6.2 percent in the United Kingdom and United States. Korea had the lowest unemployment rate at 3.5 percent, while Greece had the highest rate at 26.6 percent.
Over the last 10 years, New Zealand's best performance across the OECD was a 3rd ranking in 2007 when the harmonised unemployment rate was 3.7 percent.
Data for this section can be found at: www.socialreport.msd.govt.nz/documents/2016/pw1.xlsx
