Paid work
Median hourly earnings
Definition
Median hourly earnings from all wages and salaries for employees aged 15 years and over earning income from wage and salary jobs, and adjusted for inflation.
RelevanceTop
Median hourly earnings from wage and salary jobs are an indicator of the financial return from paid employment, independent of the number of hours worked.
Current level and trendsTop
In the June 2014 quarter, half of all people employed in wage and salary jobs earned more than $22.00 an hour. In the year to the June 2014 quarter, real (inflation-adjusted) median hourly earnings rose slightly by $0.08 or 0 percent rounded, essentially no change.
Over the last 10 years to the June 2014 quarter, real median hourly earnings rose by $3.15 or 17 percent. Two-thirds of this increase occurred in the first five years before the impact of the 2008 Global Financial Crisis. In the last five years to June 2014, real median hourly earnings rose by $1.04 or 5 percent.
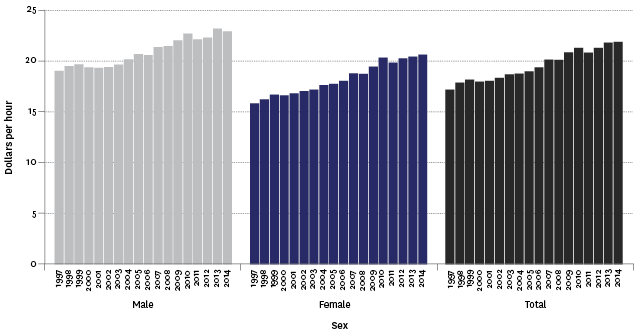
Figure PW3.1 – Real median hourly earnings from wage and salary jobs
(June 2014 dollars), by sex, June quarters, 1997–2014
Source: Statistics New Zealand, New Zealand Income Survey
Sex differencesTop
In the June 2014 quarter, real median hourly earnings were $23.02 for male employees and $20.74 for female employees. Over the last 10 years, real hourly earnings have remained lower for females than for males, although the gap has generally been narrowing.
Real median hourly earnings declined slightly for males and increased slightly for females over the year to June 2014, but again can be reported as no real change. Over the last 10 years, real median hourly earnings for females increased by $3.02 or 17 percent and for males by $2.75 or 14 percent. Over the last five years to June 2014, both male and female changes in real median hourly earnings have been more subdued, although growth for females was again greater than for males ($1.20 or 6 percent and $0.88 or 4 percent respectively).
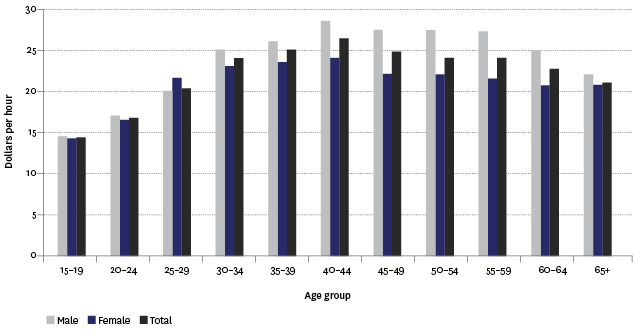
The gap between male and female median hourly earnings differs by age, with the most pronounced difference occurring in the 45–59 year age groups (June 2014).
Figure PW3.2 – Real median hourly earnings from wage and salary jobs,
by sex and age group, June quarter, 2014
Source: Statistics New Zealand, New Zealand Income Survey
Age differencesTop
In the June 2014 quarter, real median hourly earnings were highest at ages 40–44 years ($26.37), followed by 35–39 years ($25.00) and 45–49 years ($24.75). On average, over the last 10 years these age groups have ranked in the top three highest-earning age groups.
In the June 2014 quarter, real median hourly earnings were lowest at ages 15–19 years ($14.38), followed by 20–24 years ($16.74). These age groups have consistently ranked as the lowest-earning age groups.
While all age groups experienced increases in real median hourly earnings over the last 10 years, over the last five years the 25–29 age group experienced a small decline.
Table PW3.1 – Real median hourly earnings from wage and salary jobs,
by age group and percentage change, selected years
| Change | 15–19 | 20–24 | 25–29 | 30–34 | 35–39 | 40–44 | 45–49 | 50–54 | 55–59 | 60–64 | 65+ | 15+ |
|---|---|---|---|---|---|---|---|---|---|---|---|---|
| Ten years to 2014 $ | 2.71 | 1.14 | 1.40 | 3.21 | 3.20 | 5.24 | 3.37 | 2.50 | 3.62 | 3.76 | 4.54 | 3.15 |
| Ten years to 2014 % | 23 | 7 | 7 | 15 | 15 | 25 | 16 | 12 | 18 | 20 | 28 | 17 |
| Five years to 2014 $ | 0.98 | 0.30 | -0.07 | 0.39 | 0.32 | 2.79 | 1.33 | 1.38 | 2.44 | 1.24 | 2.15 | 1.04 |
| Five years to 2014 % | 7 | 2 | 0 | 2 | 1 | 12 | 6 | 6 | 11 | 6 | 11 | 5 |
Source: Statistics New Zealand, New Zealand Income Survey
Ethnic differencesTop
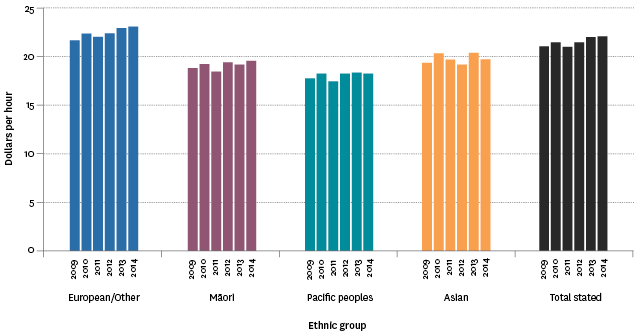
In the June 2014 quarter, the European/Other ethnic group had the highest real median hourly earnings at $23.01. They were followed by the Asian ethnic group ($19.66), Māori ($19.50) and Pacific peoples ($18.18). This ranking has remained relatively stable over the last five years, although Māori have tended to have slightly lower real hourly earnings than the Asian ethnic group over the period.
Because of changes to ethnic definitions, changes over the last 10 years should be treated with caution, but there is evidence of improvement across all ethnic groups. Over the last five years and taking into account error margins, real median hourly earnings have remained essentially unchanged for all ethnic groups, with the exception of European/Other, which showed an increase ($1.42 or 7 percent).
Figure PW3.3 – Real median hourly earnings from wage and salary jobs, by ethnic group,
June quarter, 2009–2014
Source: Statistics New Zealand, New Zealand Income Survey
Full- and part-time, qualification and occupational differencesTop
In the June 2014 quarter, median hourly earnings were highest for those with a postgraduate qualification ($33.17) and Bachelor's degree (including Honours) ($28.77). In contrast, the median hourly earnings for those with no qualification during this period was $18.00.
In terms of occupation, professionals had the highest median hourly earnings in the June 2014 quarter at $30.69, while labourers had the lowest at $16.00.
Regional differencesTop
In the June 2014 quarter, Wellington had the highest median hourly earnings ($24.07), followed by Auckland ($23.44) and Canterbury and Southland ($21.58). On average, this ranking has been consistent over the last 10 years. Median hourly earnings were lowest in Gisborne/Hawke's Bay, Northland, Manawatu-Wanganui and Tasman/Nelson/Marlborough ($20.00) and Bay of Plenty ($20.38), although over the last 10 years Tasman/Nelson/Marlborough has been the better-performing region out of this group.
In line with national results, all regions experienced growth in real median hourly earnings over the last 10 years, but there is more fluctuation in median hourly earnings received in regions over the last five years. The outliers were Southland, which had an increase of $2.28 or 12 percent, and Wellington, which had a $2.09 or 10 percent increase.
Data for this section can be found at: www.socialreport.msd.govt.nz/documents/2016/PW3.xlsx
