Civil and political rights
Voter turnout
Definition
The proportion of the estimated voting-age population (aged 18 years and over) who cast a vote in general elections.
RelevanceTop
Voter turnout rates are an indicator of the confidence the population has in political institutions, the importance they attach to them, and the extent to which they feel their participation can make a difference.
1. General electionsTop
Current level and trendsTop
General elections in New Zealand usually occur every three years, with the last election held in November 2014. Voter turnout of the eligible population in 2014 was 72 percent, an increase from 70 percent in 2011, as reported by the Electoral Commission.
In the last 30 years, voter turnout has fluctuated from a high of 89 percent in 1984 to a low of 70 percent in 2011. Overall, there has been a general decline in voter turnout over time, with the lowest percentage of people voting occurring within the last two election cycles (2011 and 2014).
The New Zealand General Social Survey (NZGSS) looked at reasons why people did not vote. The main reason people gave for not voting in the 2011 General Election was they “didn't get around to it, forgot or were not interested” (21.0 percent). Another 12.3 percent of non-voters said they did not register for the 2011 election, while 10.0 percent were “overseas or away on election day”. A further 7.1 percent of the non-voters said they did not think their vote would make a difference – a big increase from 3.9 percent in the 2008 election.
Figure CP1.1 – Proportion of estimated voting-age population who cast votes, 1984–2014
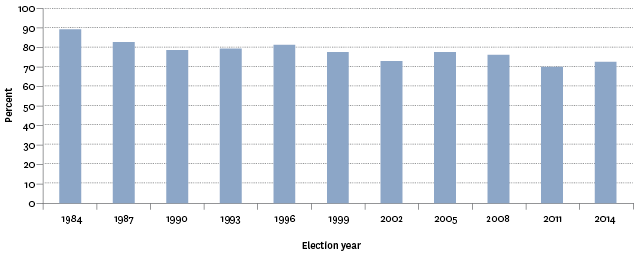
Source: Electoral Commission
Note: The 1984 figure has been calculated by the Ministry of Social Development.
Characteristics of non-votersTop
The NZGSS also looked at the demographic characteristics of non-voters. In the 2011 General Election, as age increased, the proportion of non-voters decreased. There were more non-voters aged 18–24 years than in the older age groups (41.8 percent, compared with only 5.2 percent of people aged 65 years or over).
People in the Asian ethnic group were the least likely to vote (35.3 percent did not vote) compared with those who identified as Māori (26.8 percent), Pacific peoples (17.6 percent) or European (16.8 percent). However, this is because of the large migrant population from Asia, rather than the ethnicity itself. Almost 60 percent of recent migrants did not vote in the 2011 General Election; this includes people who said they were not eligible because of visa status. Long-term migrants reported very similar voting behaviour as those born in New Zealand, with 18.2 percent and 16.3 percent respectively not voting in the 2011 General Election.
Unemployed people were less likely to vote compared with employed people and those not in the labour force. In the 2011 General Election, 35.2 percent of unemployed people did not vote. This was almost double the percentage of those not in the labour force (17.8 percent) and employed people (19.9 percent). People with personal incomes of $30,000 or less and incomes between $30,001 and $70,000 (22.8 percent and 20.3 percent respectively) were more likely not to vote than people with incomes above $70,000 (9.5 percent).
Figure CP1.2 – Proportion of non-voters by self-reported characteristics,
2008 and 2011 General Elections
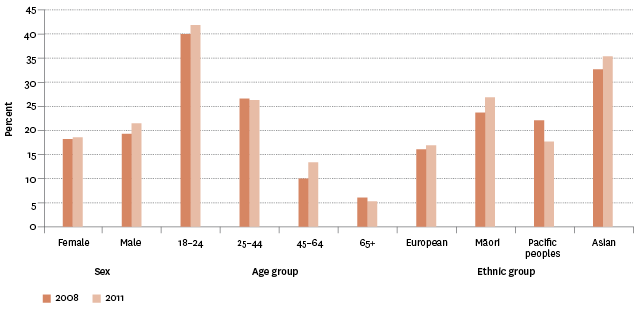
Source: Statistics New Zealand
International comparisonTop
Using a different definition of voter turnout (the proportion of the registered population who voted), New Zealand was ranked 9th out of 34 OECD countries, with a voter turnout rate of 77 percent in 2014. This was higher than the OECD median of 66 percent for recent elections.
Voter turnout in New Zealand was lower than that of Australia, where voting is compulsory (93 percent in 2013), but higher than the United Kingdom (66 percent in 2015), the United States (64 percent in 2012) and Canada (61 percent in 2011). The OECD countries with the lowest voter turnout rates were Poland (2011), Switzerland (2011) and Chile (2013) who all had rates of 49 percent.
2. Local authority electionsTop
Current level and trendsTop
Figure CP1.3 – Proportion of estimated voting-age population who cast votes in
mayoral and council elections, 1989–2013
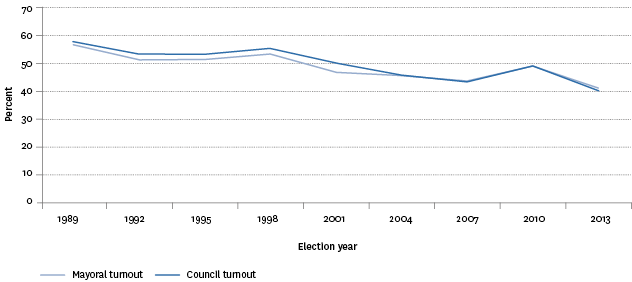
Source: Department of Internal Affairs
In the 2013 local authority elections, voter turnout was highest for district councils (48 percent), followed by regional councils (43 percent) and city councils (39 percent). Rural (fewer than 20,000 people) and provincial (20,000–90,000 people) areas had higher voter turnout than metro areas (more than 90,000 people) (50 percent, 47 percent and 38 percent respectively).
The drop in turnout between 2010 and 2013 was seen across all types of local authorities, with a fall of 9 percent in community board turnout, 9 percent in district mayoral turnout and 8 percent in district health board turnout. Other types of local authorities saw falls of between 2 and 7 percent.
Table CP1.1 – Proportion of estimated voting-age population who cast votes in
local authority elections, 1989–2013
| 1989 | 1992 | 1995 | 1998 | 2001 | 2004 | 2007 | 2010 | 2013 | |
|---|---|---|---|---|---|---|---|---|---|
| Regional councils | 56 | 52 | 48 | 53 | 49 | 45 | 43 | 47 | 43 |
| District health boards | .. | .. | .. | .. | 50 | 46 | 43 | 49 | 41 |
| Territorial authorities | |||||||||
| City councils | 52 | 48 | 49 | 51 | 45 | 43 | 41 | 46 | 39 |
| City mayors | 52 | 48 | 49 | 51 | 45 | 43 | 41 | 46 | 41 |
| District councils | 65 | 61 | 59 | 61 | 57 | 51 | 49 | 50 | 48 |
| District mayors | 67 | 62 | 59 | 59 | 56 | 52 | 49 | 50 | 41 |
| Community boards | 54 | 49 | 50 | 50 | 46 | 42 | 41 | 50 | 41 |
| Overall mayoral turnout | 57 | 53 | 53 | 55 | 50 | 46 | 44 | 49 | 41 |
| Overall council turnout | 56 | 51 | 51 | 53 | 47 | 46 | 44 | 49 | 42 |
Source: Department of Internal Affairs
Notes: District health boards were established in 2001. Trusts are not included because they are not local authorities.
Data for this section can be found at: www.socialreport.msd.govt.nz/documents/2016/cp1.xlsx
