Social connectedness
Telephone and internet access in the household
Definition
The proportion of the population with telephone access (landline and/or cellphone) in the household.
The proportion of the population with internet access in the household.
RelevanceTop
Access to a telephone and the internet helps people to maintain social connectedness. It enables social contact with friends and family in the absence of frequent face-to-face contact. The telephone also ensures an adequate line of communication in times of need and emergency.
The internet is an important means of accessing a wide range of information, services and social media. People who are unable to access information technologies, or who do not have the skills to use them, run the risk of being excluded from possible social, educational, cultural, economic and health benefits. This may have adverse effects on their educational outcomes, employment prospects, and other aspects of wellbeing.
Current level and trendsTop
The 2006 Census collected information on cellphone use for the first time. Between the 2013 and 2006 Censuses, there has been a decrease in the proportion of people who lived in households with access to landline telephones, and an increase in the proportion of people who lived in households with access to a cellphone. At the 2006 Census, 92.0 percent of people lived in households with access to a landline telephone, while at the 2013 Census this percentage had dropped to 86.5 percent. The proportion of people with access to a cellphone in the household was 79.1 percent in 2006, but rose to 86.9 percent in 2013.
At the 2013 Census, 82.0 percent of people lived in households with access to the internet, a considerable increase from 66.4 percent in 2006 and 42.9 percent in 2001.
Figure SC1.1 – Proportion of population with landline telephone, cellphone and
internet access in the household, 2001–2013
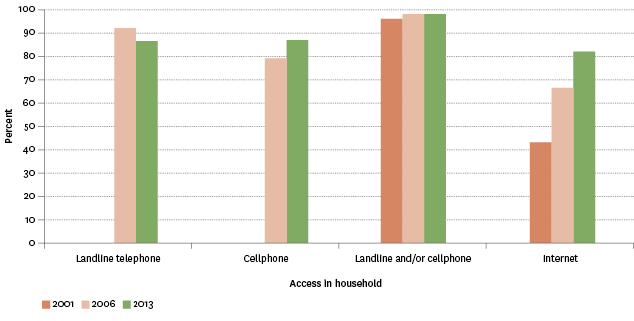
Source: Statistics New Zealand, Census of Population and Dwellings
Age and sex differencesTop
People aged 65 years and over were slightly more likely than younger people to have telephone access in their household. However, the difference narrowed between censuses, and this may be attributed to the inclusion of information collected on cellphone access from 2006 onwards and the rapid uptake of this technology, particularly by young people.
Younger people were more likely than older age groups to have access to a cellphone in the household. In 2013, 89.0 percent of those aged under 65 years had access to a cellphone in the household, compared with 82.3 percent of people aged 65–74 years and 60.9 percent of those aged 75 years and over. However, between 2006 and 2013, those aged 65 years and over experienced a greater rate of increase in access to a cellphone than younger people (increases of 18.8 percentage points for those aged 64–74 years and 21.1 percentage points for those aged 75 years and over). The increase for those aged less than 65 years was 6.4 percentage points.
There were only minor differences by age in the proportion of the population aged under 65 years living in households with internet access. However, the rates decreased as age increased. In 2013, 84.8 percent of people aged under 65 years lived in households with internet access, compared with 75.2 percent of 65–74 year olds and 49.0 percent of those aged 75 years and over. However, as with cellphone use, those aged over 65 years have experienced a greater increase in internet access, compared with younger age groups. Between 2001 and 2013, the proportion of people living in households with access to the internet increased by 54.1 percentage points for those aged 65–74 years, and by 39.0 percentage points for those aged 75 years and over. The increase for those aged under 65 years was 38.5 percentage points.
There was little difference between the sexes in telephone or internet access in the household.
Table SC1.1 – Proportion of population with telephone and internet access in the
household, by age group, sex, ethnic group and household composition, 2001–2013
| Telephone (landline and/or cellphone) access | Internet access | |||||
|---|---|---|---|---|---|---|
| 2001 | 2006 | 2013 | 2001 | 2006 | 2013 | |
| Age group | ||||||
| 0–14 | 94.6 | 97.6 | 98.3 | 45.6 | 69.1 | 83.8 |
| 15–24 | 95.3 | 97.6 | 96.6 | 47.5 | 68.0 | 84.0 |
| 25–44 | 96.1 | 98.0 | 97.7 | 47.0 | 70.8 | 86.2 |
| 45–64 | 97.7 | 98.6 | 98.6 | 45.6 | 70.9 | 84.7 |
| 65–74 | 98.3 | 98.9 | 99.1 | 21.1 | 49.7 | 75.2 |
| 75+ | 98.6 | 99.0 | 99.2 | 10.0 | 25.8 | 49.0 |
| Total | 96.3 | 98.1 | 98.1 | 42.9 | 66.4 | 82.0 |
| Sex | ||||||
| Male | 96.0 | 97.9 | 97.9 | 44.1 | 67.2 | 82.6 |
| Female | 96.5 | 98.3 | 98.3 | 41.8 | 65.5 | 81.4 |
| Ethnic group | ||||||
| European/Other | 98.1 | 98.9 | 98.7 | 45.5 | 70.4 | 84.7 |
| Māori | 88.3 | 94.4 | 96.0 | 25.3 | 46.7 | 67.0 |
| Pacific peoples | 87.0 | 95.1 | 96.8 | 20.4 | 37.7 | 65.0 |
| Asian | 97.8 | 98.7 | 98.0 | 61.5 | 77.4 | 90.2 |
| Middle Eastern/Latin American/African (MELAA) | 97.4 | 98.6 | 97.1 | 55.8 | 72.8 | 88.9 |
| Household composition | ||||||
| One parent with dependent children | 89.2 | 94.5 | 96.0 | 28.6 | 49.2 | 66.7 |
| Two parents with dependent children | 97.5 | 99.0 | 99.1 | 55.7 | 79.2 | 91.1 |
| All families with dependent children | 95.5 | 98.0 | 98.5 | 48.6 | 71.4 | 85.5 |
Source: Statistics New Zealand, Census of Population and Dwellings
Ethnic differencesTop
Access to telephones in the household remained relatively stable between 2001 and 2013 for both European/Other and Asian ethnic groups, while access increased for Māori and Pacific peoples during the same period. In 2013, 96.0 percent of Māori had access to telephones in the household, an increase from 88.3 percent in 2001 and 94.4 percent in 2006. Access to telephones in the household among Pacific peoples rose from 87.0 percent in 2001 to 95.1 percent in 2006, before reaching 96.8 percent in 2013.
Pacific peoples experienced the greatest increase in access to cellphones in the household, increasing from 72.6 percent in 2006 to 85.2 percent in 2013. All other ethnic groups experienced increases of between 7.3 and 8.6 percentage points. Access to landline telephones decreased across all ethnic groups over the same seven-year period.
Between 2001 and 2013, access to the internet in the household increased from 25.3 percent to 67.0 percent for Māori and from 20.4 percent to 65.0 percent for Pacific peoples. These levels were still well below those of the Asian ethnic group (90.2 percent), MELAA (88.9 percent) and European/Others (84.7 percent) in 2013.
Household differencesTop
Among families with dependent children, 98.5 percent had telephone access and 85.5 percent had internet access in the household in 2013. One-parent households with dependent children were less likely than two-parent households with dependent children to have access to either telephones or the internet, although the largest difference between the household types was internet access (66.7 percent compared with 91.1 percent respectively).
Regional differencesTop
At the 2013 Census, Wellington had the highest proportion of households with internet access (85.6 percent), followed by Auckland (84.9 percent), Canterbury (84.7 percent), Otago (84.4 percent) and Nelson (83.8 percent). Gisborne (68.3 percent) and Northland (73.0 percent) had the lowest proportions of households with internet access.
Data for this section can be found at: www.socialreport.msd.govt.nz/documents/2016/sc1.xlsx
