Health
Suicide
Definition
The number of suicide deaths per 100,000 population.
RelevanceTop
Intentional self-harm is an indicator of the mental health of the population and a major cause of injury-related death. Death from intentional self-harm is commonly referred to as suicide.
Current level and trendsTop
In 2012, 550 people died from suicide, an increase from the 493 people who died in 2011. The age-standardised suicide death rate was 12.1 per 100,000 population in 2012, an increase from 10.9 per 100,000 in 2011. Looking over time, the total suicide death rate increased in the mid-1980s before returning to pre-1987 levels in the 2000s.
Figure H3.1 – Suicide mortality age-standardised rates, 1972–2012
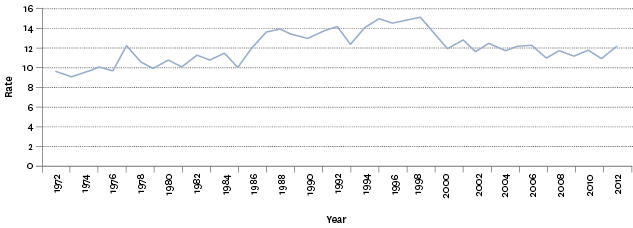
Source: Ministry of Health
Note: Rates per 100,000 population, age-standardised to the WHO World Standard population.
Sex differencesTop
Males have a consistently higher suicide death rate than females (18.1 male deaths per 100,000 male population in 2012, against 6.4 per 100,000 females). The male suicide death rate increased sharply in the mid-1980s, peaking at 23.9 deaths per 100,000 males in 1995, before declining after 1998. In 2012, it was lower than the rate in 1984 (when it was 18.3 per 100,000).
In comparison, the female rate has been relatively stable over the last 20 years. In 2012, the female suicide mortality rate was 6.4 deaths per 100,000 female population. The female suicide mortality rate has been more consistent and has not shown the same increase as males. The female rate peaked at 7.5 deaths per 100,000 female population in 1978, and has averaged 5.8 deaths per 100,000 population a year since then.
Females, however, had a much higher rate of hospitalisation resulting from intentional self-harm or attempted suicide than males. In 2012, there were 96.1 hospitalisations for intentional self-harm per 100,000 female population, while there were 46.4 hospitalisations per 100,000 male population (2.1 female hospitalisations for every male hospitalisation). In 2002, there were 98.0 hospitalisations for intentional self-harm per 100,000 female population and 52.2 hospitalisations per 100,000 male population (1.9 female hospitalisations for every male hospitalisation).
In 2012, for every female suicide death, there were 15.0 hospitalisations for intentional self-harm, while for every male suicide death there were 2.6 hospitalisations.
Figure H3.2 – Suicide mortality, numbers and age-standardised rates, by sex, 1972–2012
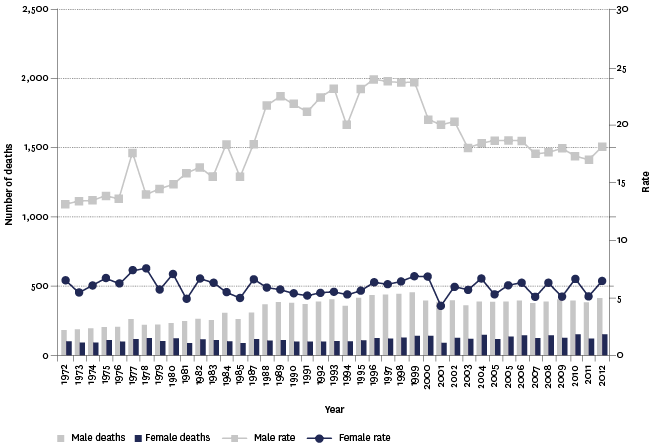
Source: Ministry of Health
Note: Rates per 100,000 population, age-standardised to the WHO World Standard population.
Age differencesTop
The 15–24 year age group had the highest suicide death rate in 2012 (23.0 per 100,000 population), followed by the 25–44 year age group (15.8 per 100,000).
Before the mid-1980s, the age groups with the highest suicide rates were 45–64 years and 65 years and over. However, a progressive decline in the rates for these two groups and an increase in the two younger age groups saw a swap in relative positions in the middle of the 1980s. The increase for the 15–24 year age group was especially sharp (from 10.8 deaths per 100,000 population in 1982 to 23.3 per 100,000 population by 1992). From the late 1990s, the 15–24 year age group’s suicide rate steadily declined. However, the 2012 rate (23.0 deaths per 100,000 15–24 year population) increased compared with 2011.
Figure H3.3 – Age-specific suicide mortality rates, by age group, 1972–2012
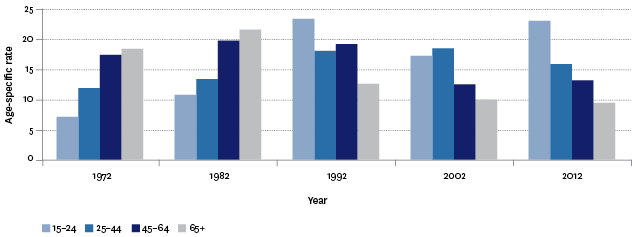
Source: Ministry of Health
Note: Rates per 100,000 population.
Ethnic differencesTop
In 2012, there were 119 Māori deaths from suicide, accounting for 21.6 percent of all suicide deaths in that year. The age-standardised rate of Māori suicide deaths in 2012 was 17.6 per 100,000 Māori population, compared with 10.6 per 100,000 non-Māori population.
The age-specific suicide death rate for Māori youth (15–24 years) in 2012 was 48.0 per 100,000 Māori youth population, compared with the non-Māori youth rate of 16.9 per 100,000. Since 1996, suicide death rates have generally declined for non-Māori but there is no obvious trend for Māori (although the small numbers of Māori suicide deaths tend to make the rates volatile from year to year, and so it can be hard to ascertain trends). In 10 of the 17 years from 1996 to 2012, Māori suicide death rates were significantly higher than those of non-Māori.
Figure H3.4 – Suicide mortality, age-standardised rates, by ethnic group, 1996–2012
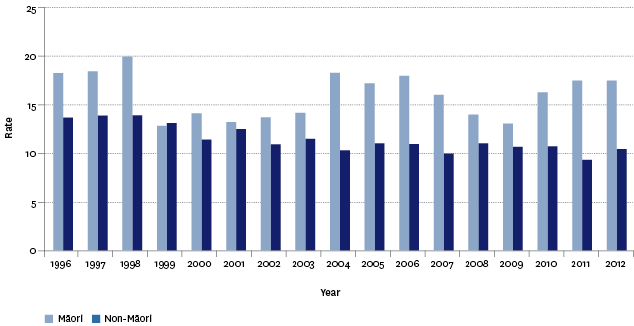
Source: Ministry of Health
Note: Rates per 100,000 population, age-standardised to the WHO World Standard population.
Socio-economic differencesTop
Suicide mortality was less prevalent in areas with lower levels of deprivation (ie NZDep2006 index of socio-economic deprivation). In 2012, the age-standardised suicide death rates for the least deprived areas were 6.6 per 100,000 population for quintile 1 and 9.3 per 100,000 population for quintile 2.
The age-standardised suicide death rate in the most deprived area (NZDep2006 quintile 5) was 13.8 per 100,000 population. In quintile 4, the rate was 16.2 per 100,000 population, and in quintile 3 it was 15.0 per 100,000 population.
International comparisonTop
A comparison with international suicide death rates for 34 OECD countries during 2009 to 2012 shows that New Zealand’s mortality rate was 13th highest for males and 5th highest for females. Korea had the highest male suicide mortality rate (37.1 deaths per 100,000 population) and female suicide mortality rate (16.3 deaths per 100,000). New Zealand’s overall suicide rate is similar to the OECD median (11.8 deaths per 100,000).
New Zealand’s youth (15–24 years) suicide rate was the highest among the 34 OECD countries, ahead of Finland for males and Korea for females.
Data for this section can be found at: www.socialreport.msd.govt.nz/documents/2016/h3.xlsx
